. 2015 Mar 15;128(6):1241-52.
doi: 10.1242/jcs.167544. Epub 2015 Jan 27.

A compartmentalized microfluidic neuromuscular co-culture system reveals spatial aspects of GDNF functions

Affiliations

A compartmentalized microfluidic neuromuscular co-culture system reveals spatial aspects of GDNF functions

Eitan Erez Zahavi et al. J Cell Sci. .

Abstract

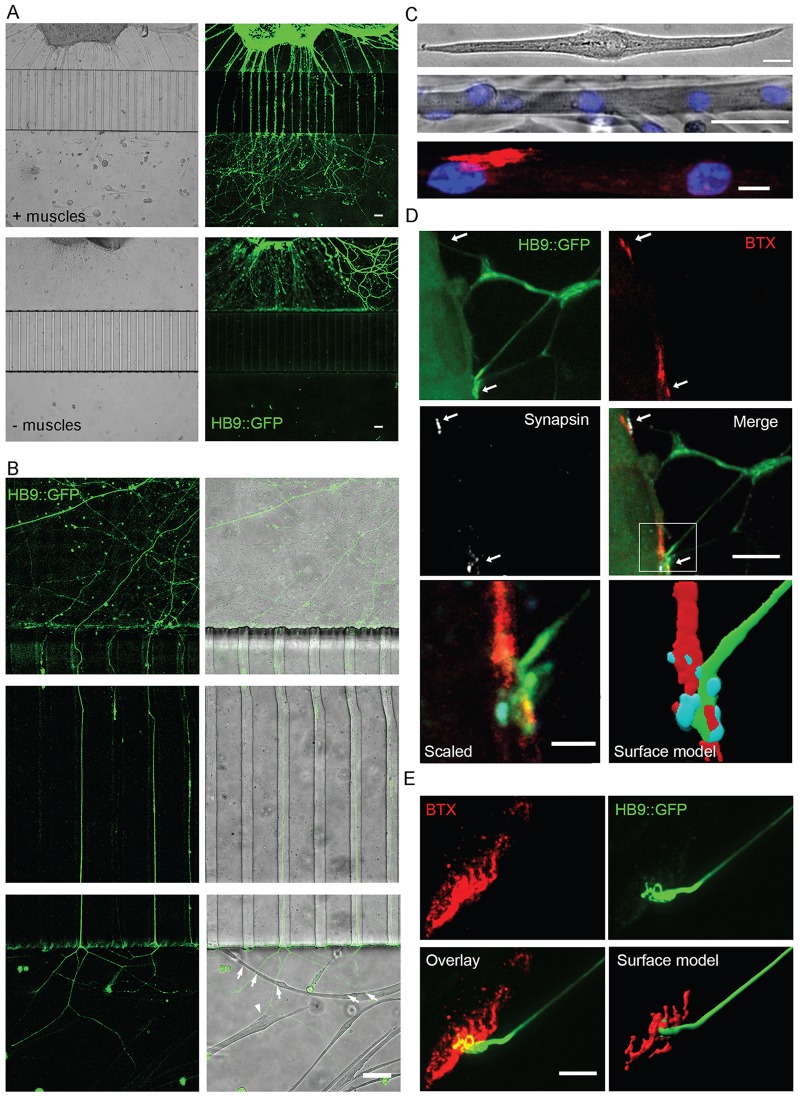
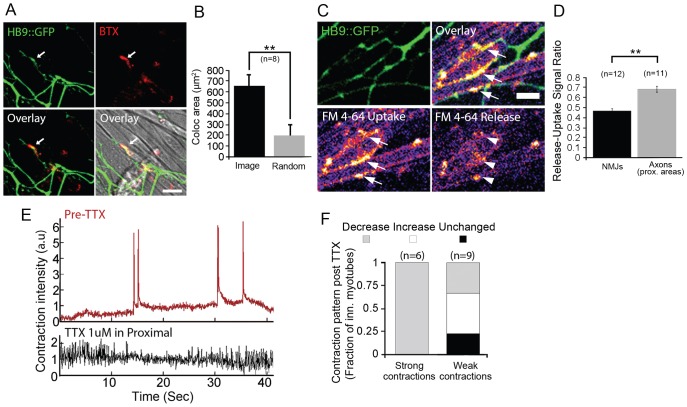
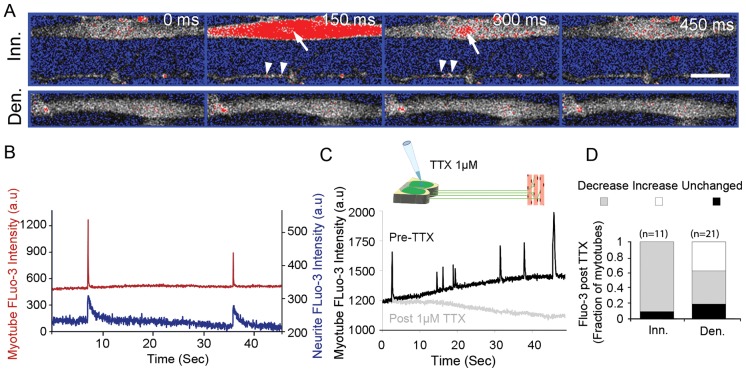
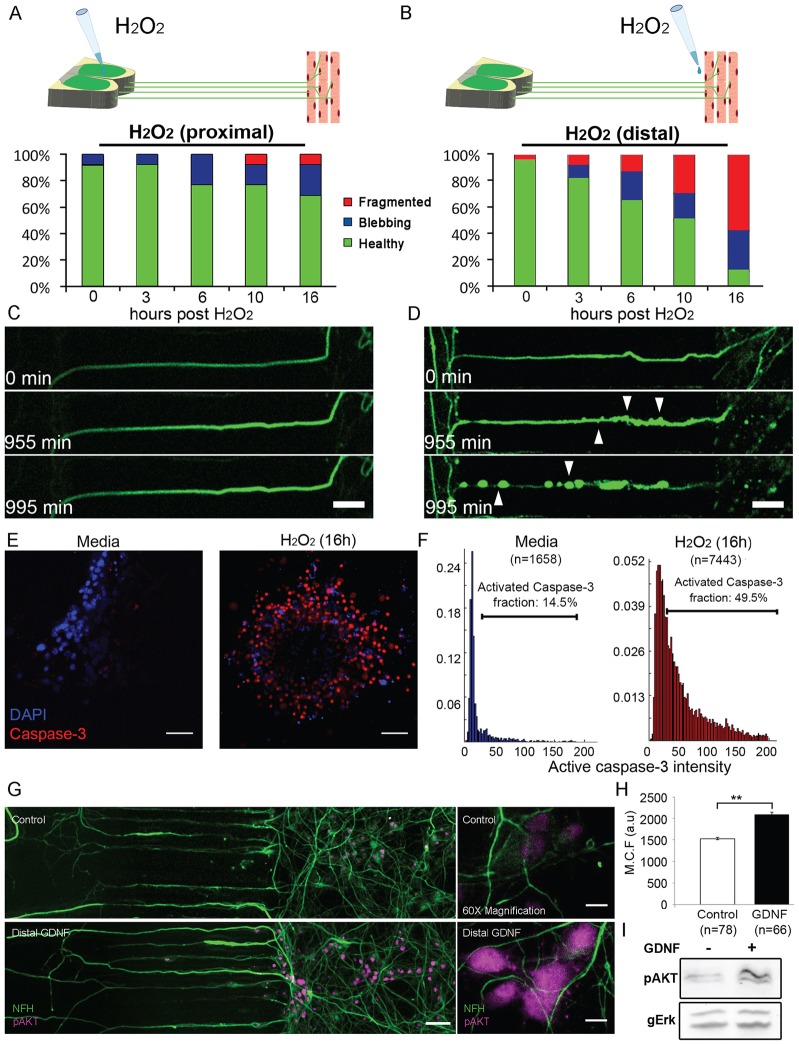
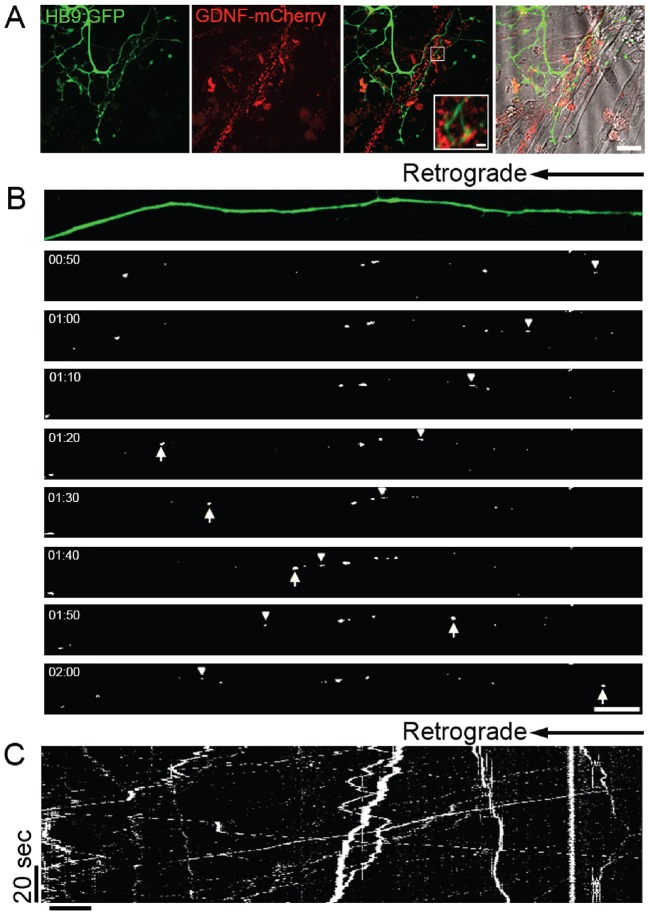
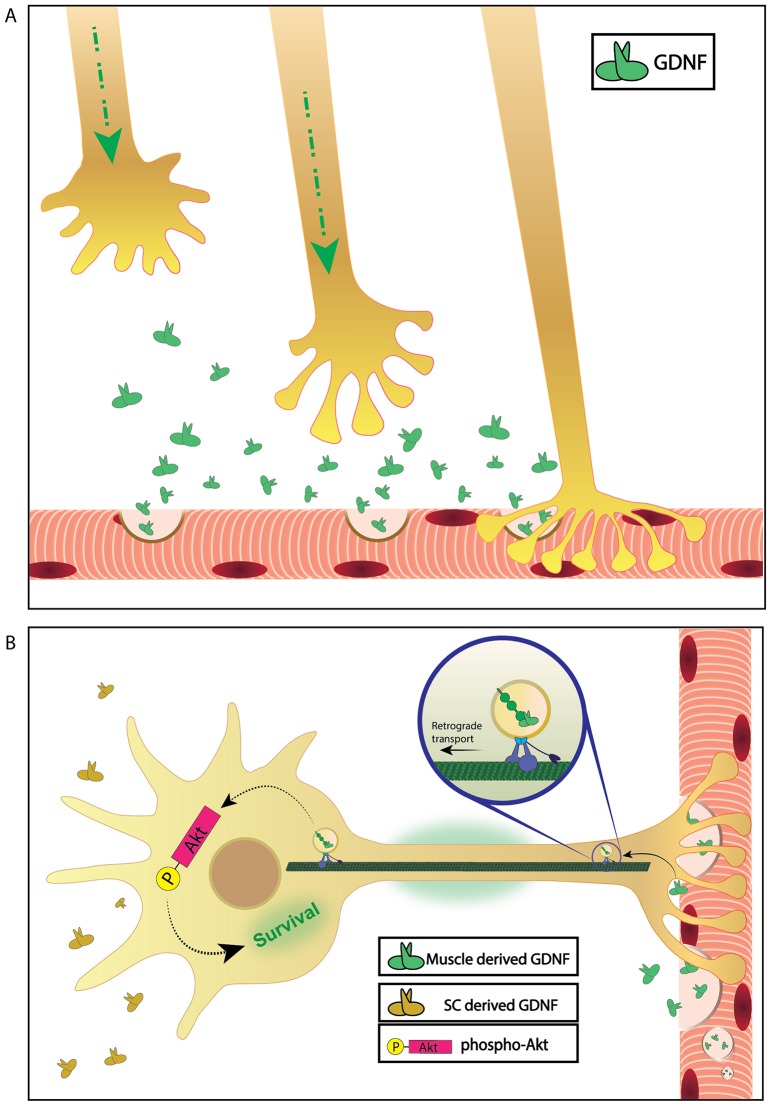
Bidirectional molecular communication between the motoneuron and the muscle is vital for neuromuscular junction (NMJ) formation and maintenance. The molecular mechanisms underlying such communication are of keen interest and could provide new targets for intervention in motoneuron disease. Here, we developed a microfluidic platform with motoneuron cell bodies on one side and muscle cells on the other, connected by motor axons extending through microgrooves to form functional NMJs. Using this system, we were able to differentiate between the proximal and distal effects of oxidative stress and glial-derived neurotrophic factor (GDNF), demonstrating a dying-back degeneration and retrograde transmission of pro-survival signaling, respectively. Furthermore, we show that GDNF acts differently on motoneuron axons versus soma, promoting axonal growth and innervation only when applied locally to axons. Finally, we track for the first time the retrograde transport of secreted GDNF from muscle to neuron. Thus, our data suggests spatially distinct effects of GDNF--facilitating growth and muscle innervation at axon terminals and survival pathways in the soma.

Keywords: Axon degeneration; Axonal transport; GDNF; Microfluidic chamber; Neuromuscular junction; Neurotrophic factors.


Figures

Fig. 1.
Fig. 1.
Axonal growth and innervation of differentiated myotubes in the MFC distal compartment. (A) Epifluorescent and corresponding brightfield images at low magnification (4× objective) of spinal cord explants growing HB9::GFP-expressing (green) axons across the microgrooves in response to muscles grown in the distal compartment (upper panels), in comparison to explants cultured without muscles (lower panels). (B) Close-up (20× objective) epifluorescent images of HB9::GFP-expressing axons growing in the proximal compartment, crossing the microgrooves and innervating myotubes in the distal compartment (upper, middle and lower panels, respectively). Arrows and arrowheads denote poly and mono-innervated myotubes, respectively. (C) Cultured myoblasts differentiate into elongated (upper image) and polynuclear striated myotubes, which were stained with Hoecsht 33258 (blue) and imaged by using a 20× objective in the Floid imaging station (middle image). Elongated polynuclear myotubes display large AChR clusters (labeled by BTX-594, red) independent of innervation (lower image). (D) High-magnification images taken with Lecia SP8 confocal microscope with a 63× objective showing formation of clusters with HB9::GFP (green), synapsin (white) and post-synaptic AChR (BTX, red) NMJ markers in axon–muscle contact areas. The arrows indicate sites of pre- and post-synaptic marker colocalization on the myotube surface. The lower panel shows a zoom-in of the contact area (left image) and a 3D surface model (right). (E) Confocal image stack projection of stained co-cultures showing HB9::GFP-expressing axons reaching an AChR pretzel-shaped cluster on a myotube. The lower-right image shows a 3D surface model of the neuromuscular contact area. See also supplementary material Movie 1. Scale bars: 50 µm (A; B; C, middle panel), 20 µm (C, upper panel), 5 µm (C, lower panel; D, upper panels; E), 1 µm (D, lower panel).
Fig. 2.
Fig. 2.
Formation of functional neuromuscular junctions in the muscle compartment. (A) Confocal images of specific colocalization (arrows) of AChR clusters in myotubes (BTX, red) and HB9::GFP (green) axons. Scale bar: 20 µm. (B) Mean colocalized area compared to random colocalization after image flipping (random). Eight images taken from a representative co-culture were analyzed. Data show the mean±s.e.m.; **P<0.01 (one-tailed Student's t-test). (C,D) Pre-synaptic uptake and release of FM-4-64 dye in NMJs. Representative confocal images using a 20× objective (left) showing HB9::GFP axon terminals (green) in contact with myotubes with puncta of uptaken FM dye (arrows) and 5 min after KCl-glutamate-induced release (arrowheads). Scale bar: 10 µm. The graph shows the mean fold reduction in the FM dye signal in NMJs compared to that in proximal (prox.) areas in a representative co-culture (±s.e.m.); **P<0.01 (one-tailed Student's t-test). (E) Representative time trace of contraction in an innervated myotube pre- and post-addition of 1 µM TTX to the neuronal compartment (see also supplementary material Movie 3). a.u., arbitrary units. (F) The fraction of myotubes displaying altered or unaffected levels of innervation-induced contractions compared to weak spontaneous contractions in innervated (inn.) myotubes post- and pre-TTX addition to the neuronal compartment.
Fig. 3.
Fig. 3.
Ca2+ imaging of myotubes and innervating axons. (A) A correlated Fluo-3 transient in axon terminals and innervated (Inn.) myotubes. A representative timecourse of epifluorescent images was taken of a single spike (upper panel) with a 20× objective. Arrowheads and arrows mark signal spiking in the axon and myotube, respectively; lower images are of a non-innervated (Den.) myotube. Scale bar: 10 µm. (B) Representative time trace showing correlated Fluo-3 spiking in a neuron (blue) and an innervated myotube (red). a.u., arbitrary units. (C) Time trace of Fluo-3 signal in an innervated myotube pre- and post-TTX (1 µM) addition to the neuronal compartment. (D) The fraction of myotubes showing altered or unaffected levels of Fluo-3 signal spikes in innervated compared to denervated neurons after TTX treatment in the neuronal compartment.
Fig. 4.
Fig. 4.
Long distance progression of oxidative stress damage and GDNF-mediated pro-survival signaling. (A,B) The graphs show the fraction of healthy, blebbing and fragmented axons after application of 1 mM H2O2 in (A) the neuronal/proximal or (B) muscle/distal compartment. (C,D) Timecourse images of HB9::GFP (green) axon degeneration. Images were taken with an epifluorescent microscope with a 10× objective. Arrowheads denote sites of axonal blebbing. Scale bars: 50 µm. (E) Epifluorescent, 20× objective images of immunostained spinal cord explants showing activated caspase-3 (red) and DAPI (blue) in the soma of control versus H2O2-treated spinal cord explants after 16 h. Scale bars: 100 µm. (F) Distribution of mean caspase-3 intensities in DAPI-positive ROIs. The caspase-3 intensity value of 40 was chosen as a cutoff between cell bodies with activated and inactivated caspase-3. (G) Stitched low-magnification image of the proximal, microgroove and distal areas of neurons in the microfluidic chamber, taken with a 20×objective. Images show phosphorylated Akt (pAkt)- and NFH-labeled neurons at 3 h after medium or GDNF treatment in the distal compartment. Scale bar: 50 µm. The right panel shows 60× objective images of neuronal soma in the proximal compartment. Scale bar: 10 µm. (H) Comparison of mean pAkt levels in cell bodies of GDNF-treated versus control-treated neurons. A total of ten fields per treatment were analyzed, containing 4–10 cells each. n, number of cells analyzed. Data show the mean±s.e.m.; **P<0.01 (one-tailed Student's t-test). (I) Representative western blot image of pAkt and gERK (total Erk1/2 as loading control) of lysate from the soma compartment of distal GDNF-treated versus medium-treated cultures.
Fig. 5.
Fig. 5.
GDNF facilitates axonal growth and muscle innervation when added specifically to the axonal/muscle compartment. (A,B) Mean axonal length in the muscle compartment normalized to the area of measurement in the chamber treated with GDNF in (A) the neuronal cell body or (B) muscle compartments compared to the control. Two images of each co-culture muscle compartment from two independent experiments were pooled and analyzed. Data show the mean±s.e.m.; *P<0.05; n.s., non-significant (one-tailed Student's t-test). (C) Mean rate of functionally innervated muscles, measured according to their contractile behavior in the distal side GDNF treatment condition compared to the control, at 48 h after treatment. See Materials and Methods for further details. Data were taken from two independent experiments and show the mean±s.e.m.; *P<0.05 (one-tailed Student's t-test). (D) Representative epifluorescent and brightfield images, taken with a 20× objective, of myotubes innervated by HB9::GFP-expressing (green) axons that were not contracting (arrows) and myotubes displaying typical innervation-induced contraction (arrowheads). Scale bar: 25 µm.
Fig. 6.
Fig. 6.
Retrograde transport of muscle-secreted GDNF in motoneuron axons. (A) Confocal 60× objective images of HB9::GFP-expressing axons (green) in contact with myocytes expressing GDNF–mCherry (red) at 5 days after lentiviral infection. (B) Timecourse images taken using a confocal microscope and a 60× objective showing retrograde (arrowheads) and anterograde (arrows) transport of GDNF–mCherry in a HB9::GFP-expressing motoneuron. (C) Kymograph of GDNF–mCherry transport along an HB9::GFP-expressing axon. Scale bars: 20 µm (A), 10 µm (B,C), 2 µm (A, inset).
Fig. 7.
Fig. 7.
Model depicting the dual function of GDNF in motoneurons in promoting local axonal growth and innervation and long-distance survival signaling. (A) Local effect of GDNF on axonal growth, guidance and NMJ formation. (B) Long-distance effect of retrograde-transported GDNF in activating pro-survival signals in the cell body.

References

    1. Acsadi G., Anguelov R. A., Yang H., Toth G., Thomas R., Jani A., Wang Y., Ianakova E., Mohammad S., Lewis R. A. et al.(2002). Increased survival and function of SOD1 mice after glial cell-derived neurotrophic factor gene therapy. Hum. Gene Ther. 13, 1047–1059 10.1089/104303402753812458 - DOI - PubMed
    1. Airaksinen M. S., Saarma M. (2002). The GDNF family: signalling, biological functions and therapeutic value. Nat. Rev. Neurosci. 3, 383–394 10.1038/nrn812 - DOI - PubMed
    1. Baudet C., Pozas E., Adameyko I., Andersson E., Ericson J., Ernfors P. (2008). Retrograde signaling onto Ret during motor nerve terminal maturation. J. Neurosci. 28, 963–975 10.1523/JNEUROSCI.4489-07.2008 - DOI - PMC - PubMed
    1. Beauchamp J. R., Heslop L., Yu D. S., Tajbakhsh S., Kelly R. G., Wernig A., Buckingham M. E., Partridge T. A., Zammit P. S. (2000). Expression of CD34 and Myf5 defines the majority of quiescent adult skeletal muscle satellite cells. J. Cell Biol. 151, 1221–1234 10.1083/jcb.151.6.1221 - DOI - PMC - PubMed
    1. Conforti L., Adalbert R., Coleman M. P. (2007). Neuronal death: where does the end begin? Trends Neurosci. 30, 159–166 10.1016/j.tins.2007.02.004 - DOI - PubMed

Publication types

MeSH terms

Substances