Review
. 2015;68(5):833-57.
doi: 10.1080/17470218.2015.1008020. Epub 2015 Mar 2.

The point of no return: A fundamental limit on the ability to control thought and action

Affiliations
Review

The point of no return: A fundamental limit on the ability to control thought and action

Gordon D Logan. Q J Exp Psychol (Hove). 2015.

Abstract

Bartlett (1958. Thinking. New York: Basic Books) described the point of no return as a point of irrevocable commitment to action, which was preceded by a period of gradually increasing commitment. As such, the point of no return reflects a fundamental limit on the ability to control thought and action. I review the literature on the point of no return, taking three perspectives. First, I consider the point of no return from the perspective of the controlled act, as a locus in the architecture and anatomy of the underlying processes. I review experiments from the stop-signal paradigm that suggest that the point of no return is located late in the response system. Then I consider the point of no return from the perspective of the act of control that tries to change the controlled act before it becomes irrevocable. From this perspective, the point of no return is a point in time that provides enough "lead time" for the act of control to take effect. I review experiments that measure the response time to the stop signal as the lead time required for response inhibition in the stop-signal paradigm. Finally, I consider the point of no return in hierarchically controlled tasks, in which there may be many points of no return at different levels of the hierarchy. I review experiments on skilled typing that suggest different points of no return for the commands that determine what is typed and the countermands that inhibit typing, with increasing commitment to action the lower the level in the hierarchy. I end by considering the point of no return in perception and thought as well as action.

Keywords: Cognitive control; Hierarchical control; Point of no return; Response inhibition; Stop signal.


Figures

Figure 1
Figure 1
Logan (1981) Experiment 1: (A) Probability of responding given a stop signal as a function of stop signal delay in an experiment that varied the probability of a stop signal (0.1 vs. 0.2) and varied whether stop signal delay was random or fixed for a block of trials. Go RT increased strategically with stop signal probability and it increased when stop signal delay was fixed, increasing more the longer the stop signal delay. (B) Probability of responding given a stop signal from (A) plotted as a function of the time between the onset of the stop signal and the onset of the response (mean go RT minus stop signal delay). Data points are means across subjects in each condition.
Figure 1
Figure 1
Logan (1981) Experiment 1: (A) Probability of responding given a stop signal as a function of stop signal delay in an experiment that varied the probability of a stop signal (0.1 vs. 0.2) and varied whether stop signal delay was random or fixed for a block of trials. Go RT increased strategically with stop signal probability and it increased when stop signal delay was fixed, increasing more the longer the stop signal delay. (B) Probability of responding given a stop signal from (A) plotted as a function of the time between the onset of the stop signal and the onset of the response (mean go RT minus stop signal delay). Data points are means across subjects in each condition.
Figure 2
Figure 2
Logan, Cowan and Davis (1984): (A) Probability of responding given a stop signal as a function of stop signal delay for a simple (open circles) and choice (filled squares) go task. Go RT was substantially shorter in the simple task. (B) Probability of responding given a stop signal as a function of mean go RT minus stop signal delay for simple and choice tasks. Data points are individual subject means in each condition.
Figure 2
Figure 2
Logan, Cowan and Davis (1984): (A) Probability of responding given a stop signal as a function of stop signal delay for a simple (open circles) and choice (filled squares) go task. Go RT was substantially shorter in the simple task. (B) Probability of responding given a stop signal as a function of mean go RT minus stop signal delay for simple and choice tasks. Data points are individual subject means in each condition.
Figure 3
Figure 3
Logan and Irwin (2000): (A) Probability of responding given a stop signal for eye movements (open circles) and keypresses with the hands (filled squares) in a go task in which subjects responded to a cued location (left or right). (B). Probability of responding given a stop signal plotted as a function of go response time minus stop signal delay. Data points are individual subject means in each condition.
Figure 3
Figure 3
Logan and Irwin (2000): (A) Probability of responding given a stop signal for eye movements (open circles) and keypresses with the hands (filled squares) in a go task in which subjects responded to a cued location (left or right). (B). Probability of responding given a stop signal plotted as a function of go response time minus stop signal delay. Data points are individual subject means in each condition.
Figure 4
Figure 4
Logan (1981) Experiment 2: (A) Probability of responding given a stop signal delay in an experiment that varied discrimination difficulty (wide vs. narrow spacing) and stimulus-response compatibility. Go RT increased with discrimination difficulty and with stimulus-response compatibility, but there was no interaction between them, suggesting that they affected different processing stages. (B) Probability of responding given a stop signal as a function of the interval between mean go RT and stop signal delay. Data points are means across subjects in each condition.
Figure 4
Figure 4
Logan (1981) Experiment 2: (A) Probability of responding given a stop signal delay in an experiment that varied discrimination difficulty (wide vs. narrow spacing) and stimulus-response compatibility. Go RT increased with discrimination difficulty and with stimulus-response compatibility, but there was no interaction between them, suggesting that they affected different processing stages. (B) Probability of responding given a stop signal as a function of the interval between mean go RT and stop signal delay. Data points are means across subjects in each condition.
Figure 5
Figure 5
Logan, Cowan and Davis (1984): Probability of responding given a stop signal in a simple or choice reaction time (RT) task as a function of go RT minus stop signal delay. The probability of responding is near 1.0 when mean minus delay equals 0. A lead time of nearly 200 ms is required in order to inhibit 50% of the time. This lead time represents stop signal reaction time (SSRT).
Figure 6
Figure 6
Logan, Van Zandt, Verbruggen, and Wagenmakers (2014): Distributions of stop signal reaction time (SSRT) estimated by fitting a diffusion race model to data from 2 choice reaction time experiment (SSD = stop signal delay).
Figure 7
Figure 7
Williams, Ponesse, Schachar, Logan, and Tannock (1999): Mean go reaction time (Go RT) and stop signal reaction time (SSRT) as a function of age group. The number of subjects in each group is in brackets.
Figure 8
Figure 8
Logan (1982): (A) Probability of responding as a function of stop signal delay for the first and last keystrokes of 3, 5, and 7 letter words typed by skilled typists. (B) Probability of responding as a function of keystroke latency minus stop signal delay. Data points are means across subjects in each condition.
Figure 8
Figure 8
Logan (1982): (A) Probability of responding as a function of stop signal delay for the first and last keystrokes of 3, 5, and 7 letter words typed by skilled typists. (B) Probability of responding as a function of keystroke latency minus stop signal delay. Data points are means across subjects in each condition.
Figure 9
Figure 9
Number of keystrokes typed after a stop signal in professional typists (Logan, 1982) and modern university students (Bissett, unpublished).
Figure 10
Figure 10
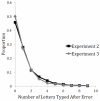
Crump and Logan (2013) Experiments 2 and 3: Number of keystrokes struck between making an error and detecting it when skilled typists type text.
Figure 11
Figure 11
Yamaguchi, Logan, and Li (2013): Probability of interrupting the typing of the first through fifth letters of a word to make a vocal response to a secondary tone (stimulus onset asynchrony = 50 ms).
Figure 12
Figure 12
Snyder and Logan (2013): Mean interkeystroke intervals in typing words in which no keystrokes were inhibited or monitored (Control), in words in which single keystrokes had to be inhibited (Inhibit), and in words in which typists had to report whether they typed a particular single keystroke (Monitor).
Figure 13
Figure 13
Yamaguchi (unpublished): Interkeystroke interval for typing “the instance theory is right” (Intact), “right the is instance theory” (Scrambled Words), “hte ticsenan htoyre si ithgr” (Scrambled Letters), and “trghi het si taesncin tyhore” (Both Scrambled) in 9 skilled typists.
Figure 14
Figure 14
Crump and Logan (2010): Response times to probes preceded by auditory primes. The probes required typists to type the primed word (Word), the First, Middle, or Last letter of the primed word, or an Other letter that did not appear in the word. Response times were longer for Other letters than for letters that were part of the primed word.
Figure 15
Figure 15
Logan, Miller and Strayer (2011): Peak amplitudes of lateralized readiness potential (difference between C3 and C4 electrodes) for the first keystroke in words whose letters are all typed in one hand (All, e.g., rest), words whose first two letters are typed in one hand and the remainder typed with the other (First Two, e.g., swim), and words whose first letters were typed in one hand and the remaining letters typed with the other (First, e.g., dump).
Figure 16
Figure 16
Schneider and Logan (2005): Mean response time as a function of digit for magnitude and parity judgments.

Similar articles

Cited by

References

    1. Allport DA. Selection for action: Some behavioural and neurophysiological considerations of attention and action. In: Heuer H, Sanders AF, editors. Perspectives on perception and action. Erlbaum; Hillsdale, NJ: 1987. pp. 395–419.
    1. Anderson JR. How can the human mind occur in the physical universe? Oxford University Press; Oxford: 2007.
    1. Anderson MC, Ochsner KN, Kuhl B, Cooper J, Robertson E, Gabrieli SW, Glover GH, Gabrieli JD. Neural systems underlying the suppression of unwanted memories. Science. 2004;303:232–235. - PubMed
    1. Aron AR, Duston S, Eagle DM, Logan GD, Stinear CM, Stuphorn V. Converging evidence for a fronto-basal-ganglia system for inhibitory control of action and cognition. Journal of Neuroscience. 2007;27:11860–11864. - PMC - PubMed
    1. Arrington CM, Logan GD. The cost of a voluntary task switch. Psychological Science. 2004;15:610–615. - PubMed

Publication types

LinkOut - more resources