

Molecular characterization of three gonadotropin subunits and their expression patterns during ovarian maturation in Cynoglossus semilaevis
- PMID: 25633101
- PMCID: PMC4346864
- DOI: 10.3390/ijms16022767
Molecular characterization of three gonadotropin subunits and their expression patterns during ovarian maturation in Cynoglossus semilaevis
Abstract
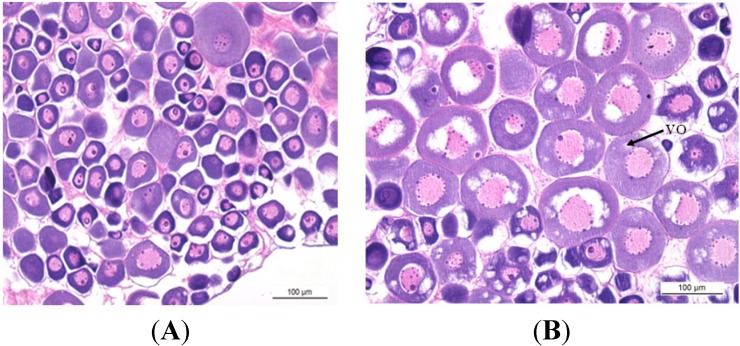
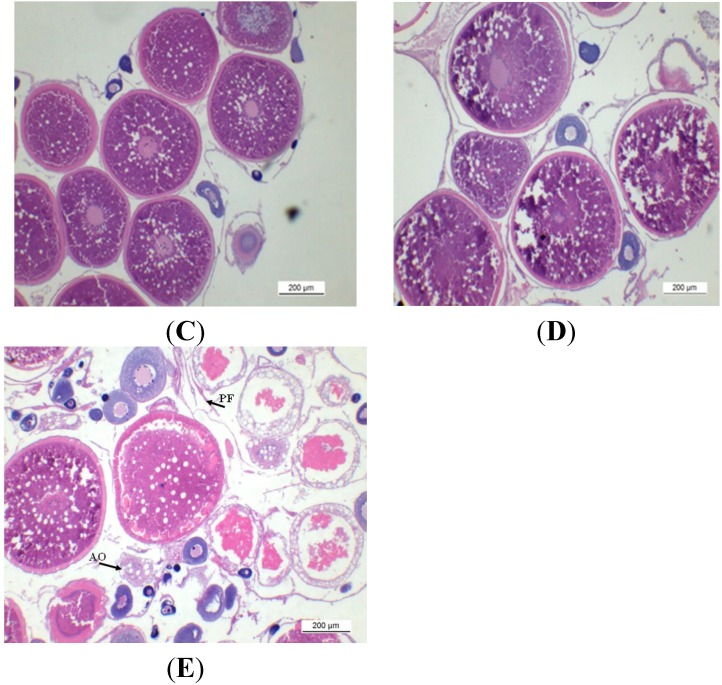
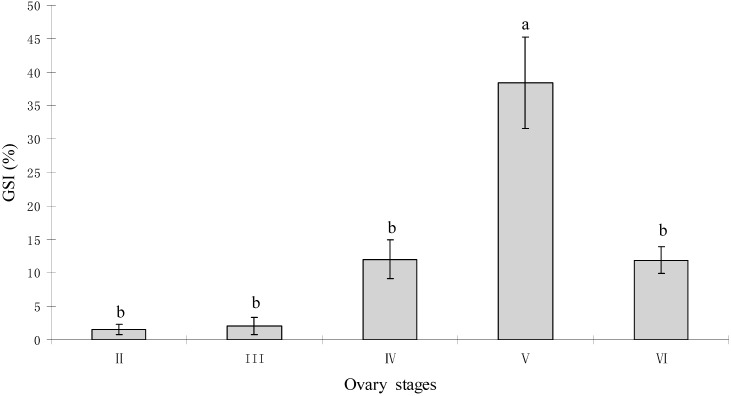
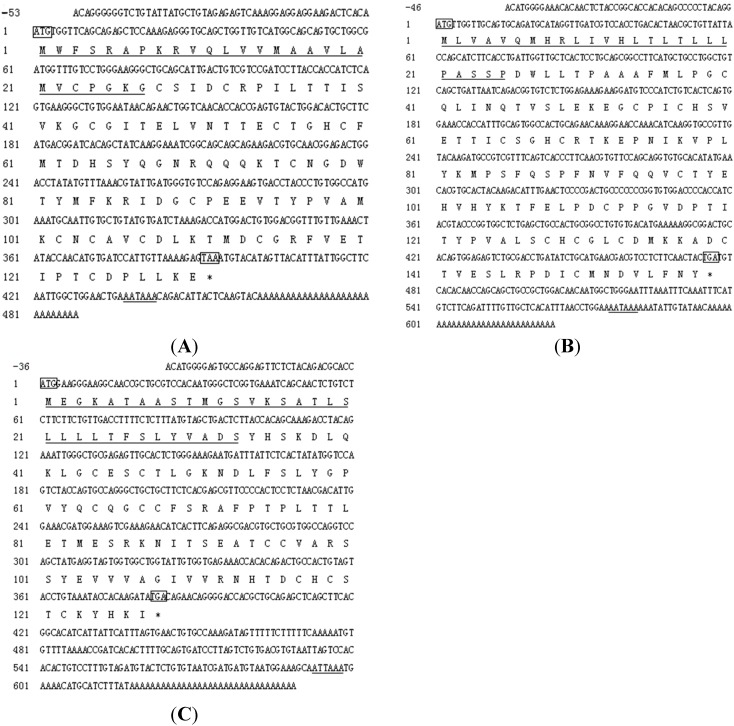
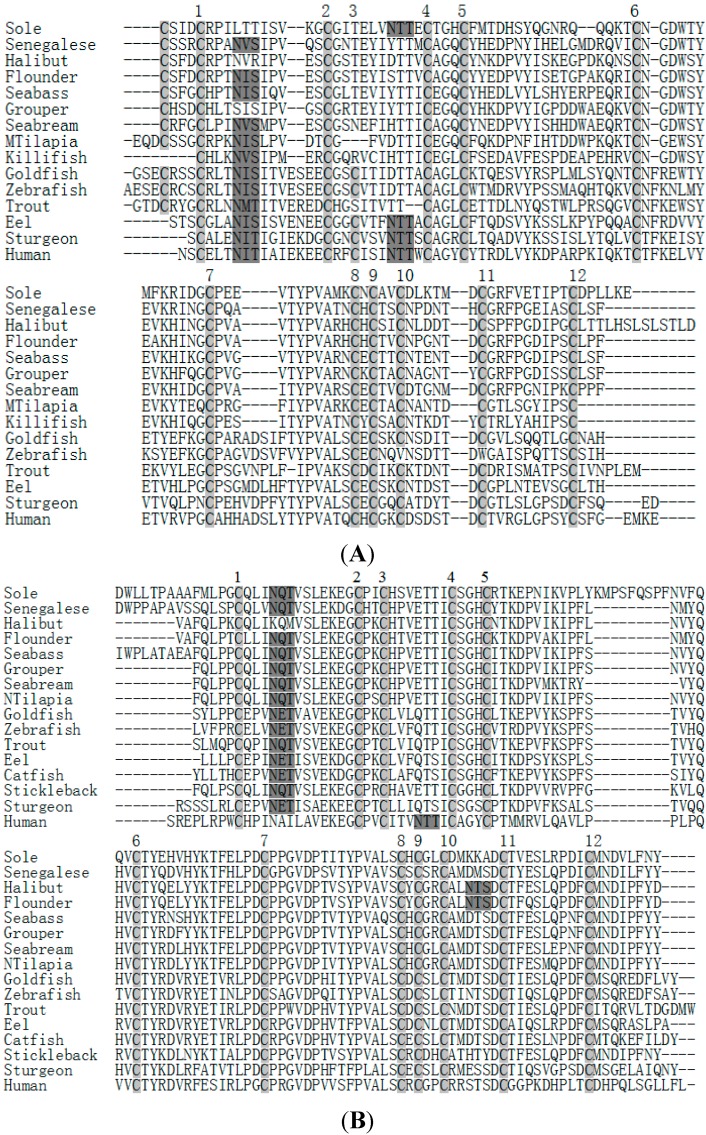
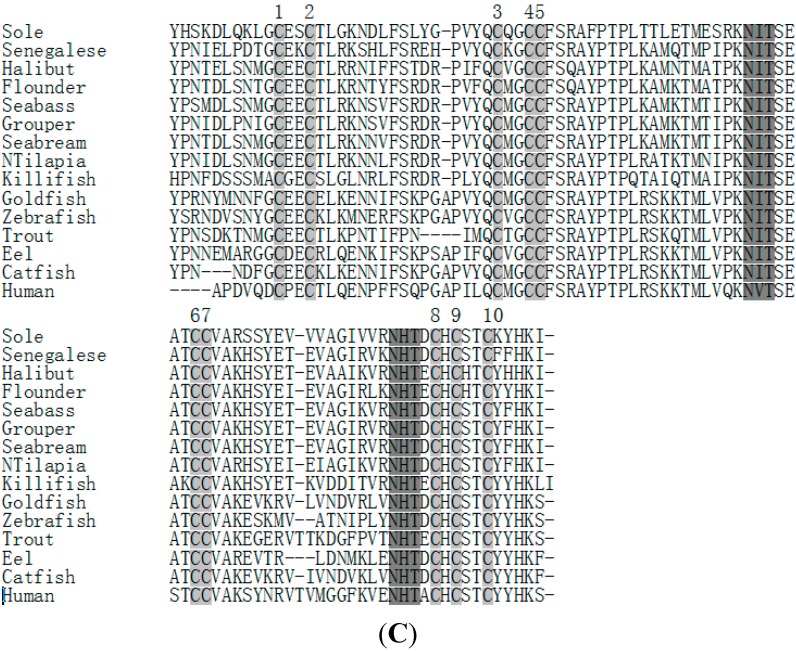
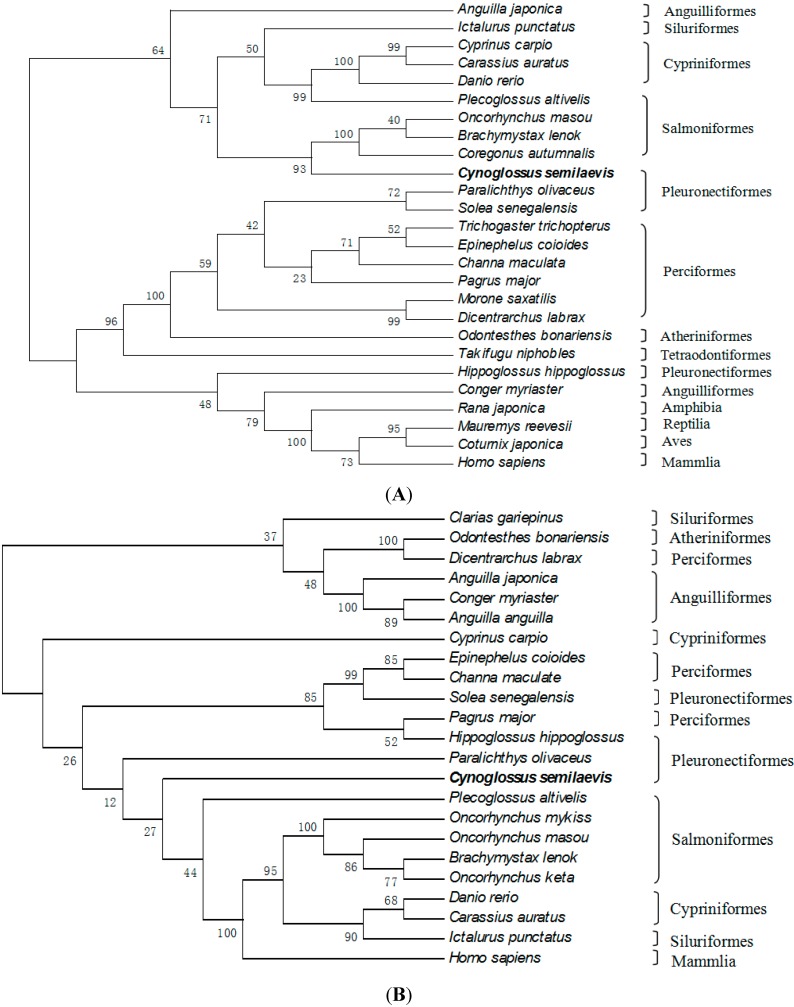
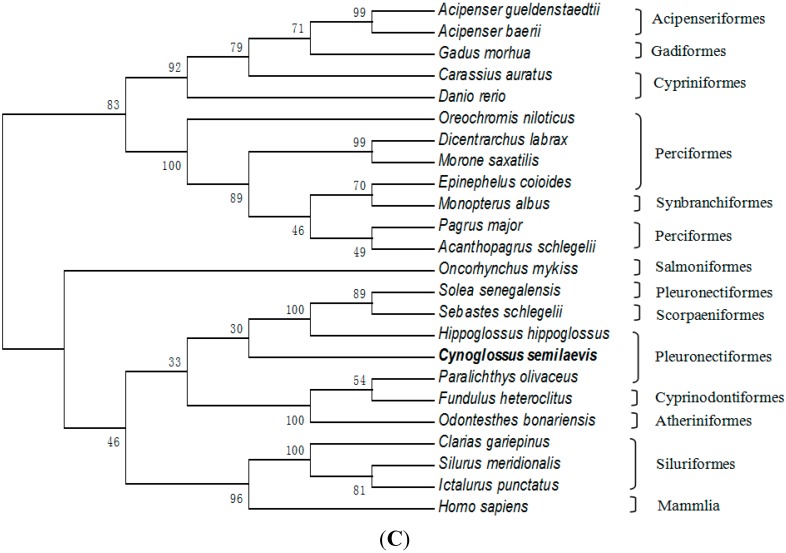
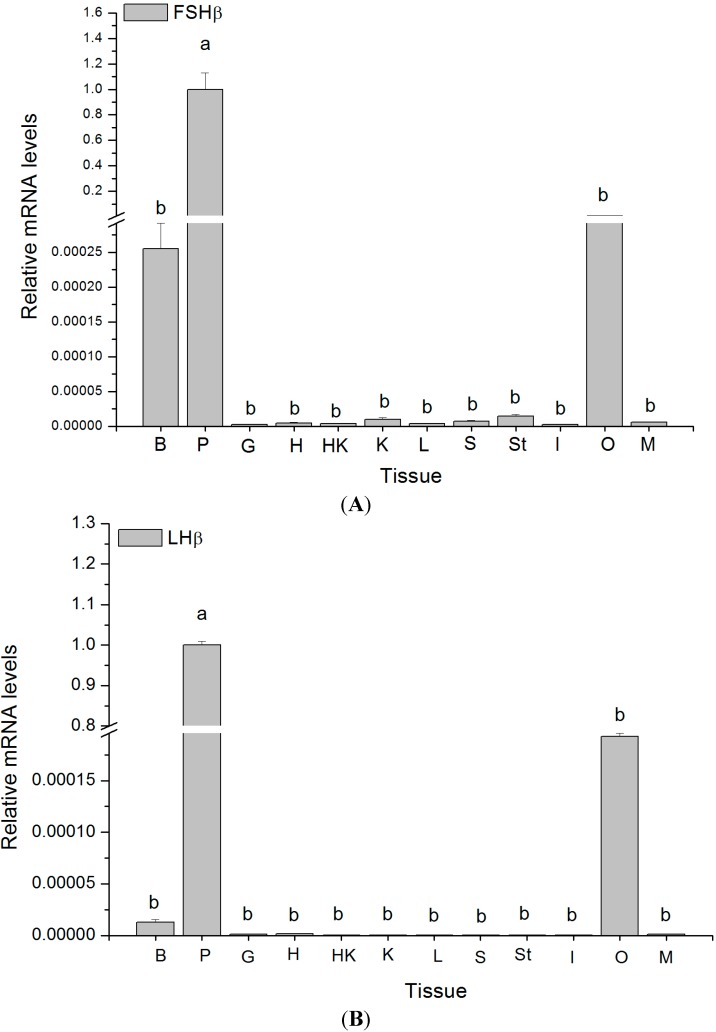
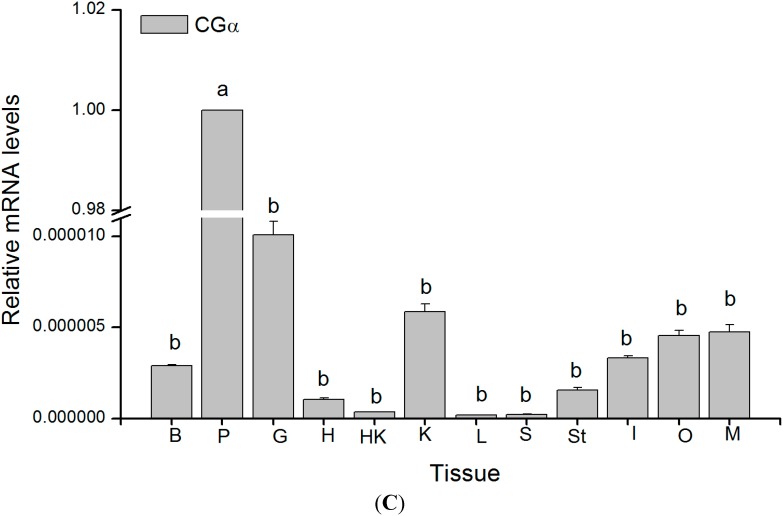
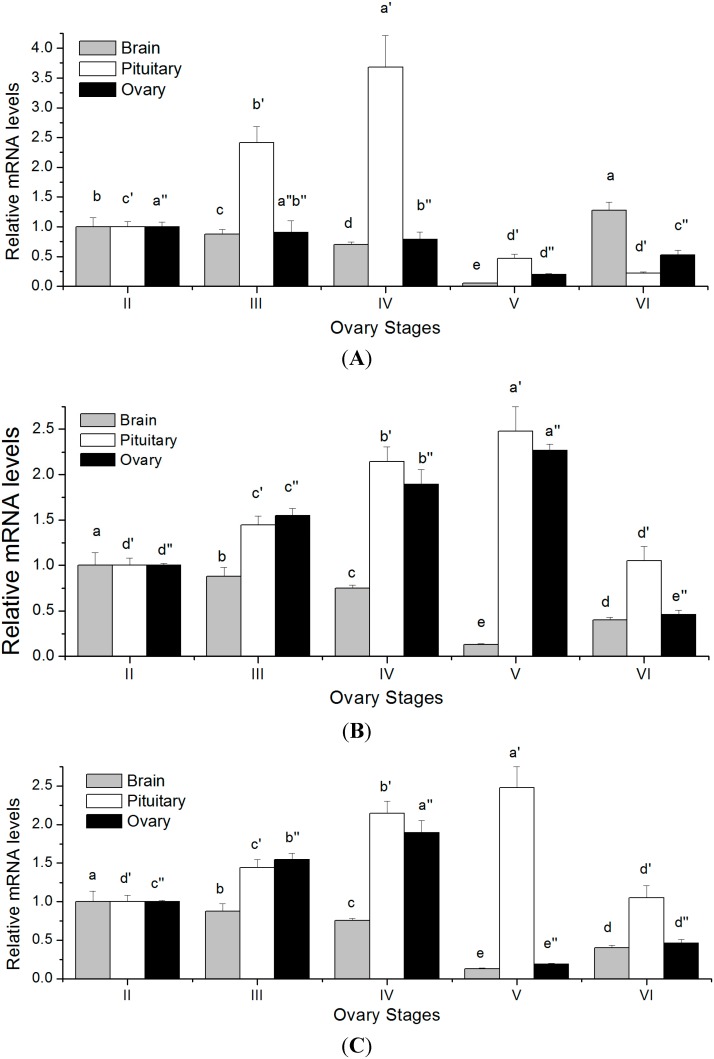
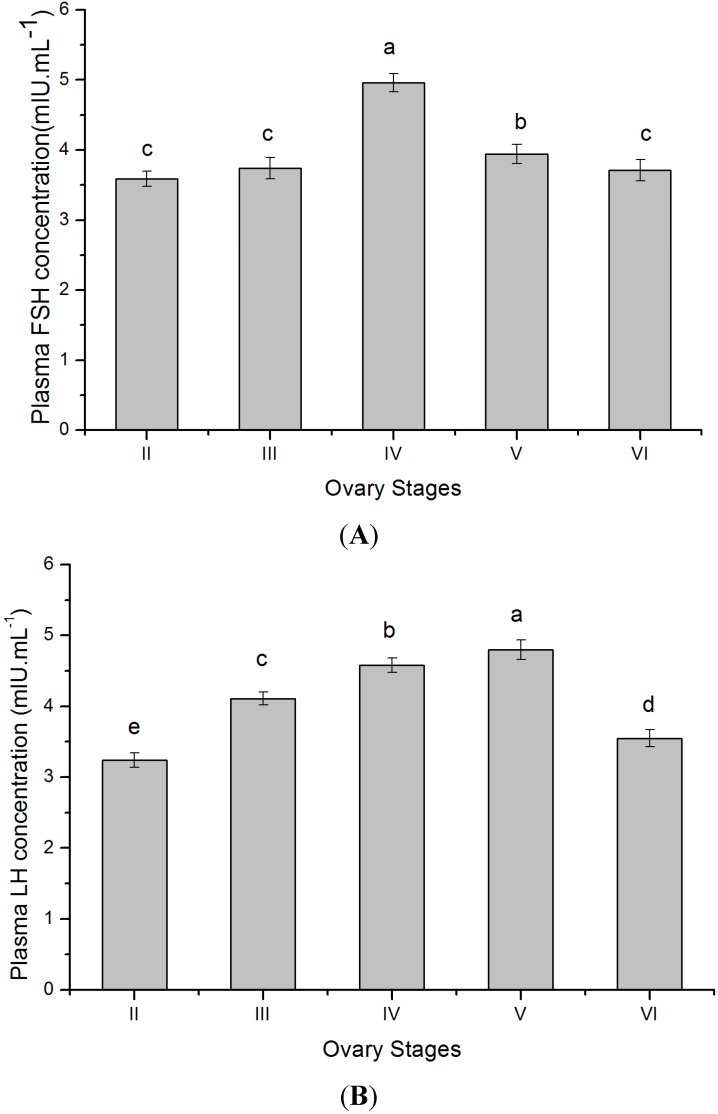
The endocrine regulation of reproduction in a multiple spawning flatfish with an ovary of asynchronous development remains largely unknown. The objectives of this study were to monitor changes in mRNA expression patterns of three gonadotropin hormone (GTH) subunits (FSHβ, LHβ and CGα) and plasma GTH levels during ovarian maturation of half-smooth tongue sole Cynoglossus semilaevis. Cloning and sequence analysis revealed that the cDNAs of FSHβ, LHβ and CGα were 541, 670 and 685 bp in length, and encode for peptides of 130, 158 and 127 amino acids, respectively. The number of cysteine residues and potential N-linked glycosylation sites of the flatfish GTHs were conserved among teleosts. However, the primary structure of GTHs in Pleuronectiformes appeared to be highly divergent. The FSHβ transcriptional level in the pituitary remained high during the vitellogenic stage while plasma levels of FSH peaked and oocyte development was stimulated. The LHβ expression in the pituitary and ovary reached the maximum level during oocyte maturation stages when the plasma levels of LH peaked. The brain GTHs were expressed at the different ovarian stages. These results suggested that FSH and LH may simultaneously regulate ovarian development and maturation through the brain-pituitary-ovary axis endocrine system in tongue sole.
Figures
Similar articles
-
Molecular and expression characterization of three gonadotropin subunits common alpha, FSHbeta and LHbeta in groupers.Mol Cell Endocrinol. 2005 Apr 15;233(1-2):33-46. doi: 10.1016/j.mce.2005.01.010. Mol Cell Endocrinol. 2005. PMID: 15767044
-
Molecular and transcriptional characterization of GTHs and mPRα during ovarian maturation in rock bream Oplegnathus fasciatus.J Exp Zool A Ecol Genet Physiol. 2015 Aug;323(7):430-44. doi: 10.1002/jez.1939. Epub 2015 Jun 2. J Exp Zool A Ecol Genet Physiol. 2015. PMID: 26036840
-
Molecular cloning and characterization of the gonadotropin subunits GPα, FSHβ, and LHβ genes in the stinging catfish Heteropneustes fossilis: phylogeny, seasonal expression and pituitary localization.J Exp Zool A Ecol Genet Physiol. 2015 Oct;323(8):567-85. doi: 10.1002/jez.1949. Epub 2015 Jul 23. J Exp Zool A Ecol Genet Physiol. 2015. PMID: 26205349
-
Possible role of PACAP and its PAC1 receptor in the differential regulation of pituitary LHbeta- and FSHbeta-subunit gene expression by pulsatile GnRH stimulation.Biol Reprod. 2013 Feb 14;88(2):35. doi: 10.1095/biolreprod.112.105601. Print 2013 Feb. Biol Reprod. 2013. PMID: 23197164 Review.
-
Molecular function of gonadotrophins and their receptors in the ovarian development of turbot (Scophthalmus maximus).Gen Comp Endocrinol. 2019 Jun 1;277:17-19. doi: 10.1016/j.ygcen.2019.02.014. Epub 2019 Feb 12. Gen Comp Endocrinol. 2019. PMID: 30769011 Review.
Cited by
-
Brain and Pituitary Transcriptome Analyses Reveal the Differential Regulation of Reproduction-Related LncRNAs and mRNAs in Cynoglossus semilaevis.Front Genet. 2021 Dec 9;12:802953. doi: 10.3389/fgene.2021.802953. eCollection 2021. Front Genet. 2021. PMID: 34956338 Free PMC article.
-
New evidence for SPX2 in regulating the brain-pituitary reproductive axis of half-smooth tongue sole (Cynoglossus semilaevis).Front Endocrinol (Lausanne). 2022 Aug 1;13:984797. doi: 10.3389/fendo.2022.984797. eCollection 2022. Front Endocrinol (Lausanne). 2022. PMID: 35979437 Free PMC article.
-
Evidences for involvement of growth hormone and insulin-like growth factor in ovarian development of starry flounder (Platichthys stellatus).Fish Physiol Biochem. 2017 Apr;43(2):527-537. doi: 10.1007/s10695-016-0307-2. Epub 2016 Nov 2. Fish Physiol Biochem. 2017. PMID: 27807711
-
Gonadotropins and Sex Steroid Hormones in Captive-Reared Small Yellow Croaker (Larimichthys polyactis) and Their Role in Female Reproductive Dysfunction.Int J Mol Sci. 2023 May 17;24(10):8919. doi: 10.3390/ijms24108919. Int J Mol Sci. 2023. PMID: 37240265 Free PMC article.
-
Comprehensive CircRNA Profiling and Selection of Key CircRNAs Reveal the Potential Regulatory Roles of CircRNAs throughout Ovarian Development and Maturation in Cynoglossus semilaevis.Biology (Basel). 2021 Aug 26;10(9):830. doi: 10.3390/biology10090830. Biology (Basel). 2021. PMID: 34571707 Free PMC article.
References
Publication types
MeSH terms
Substances
LinkOut - more resources
Full Text Sources
Other Literature Sources
