. 2015 Jan 30:5:8132.
doi: 10.1038/srep08132.

Synechococcus elongatus UTEX 2973, a fast growing cyanobacterial chassis for biosynthesis using light and CO₂

Affiliations

Synechococcus elongatus UTEX 2973, a fast growing cyanobacterial chassis for biosynthesis using light and CO₂

Jingjie Yu et al. Sci Rep. .

Abstract

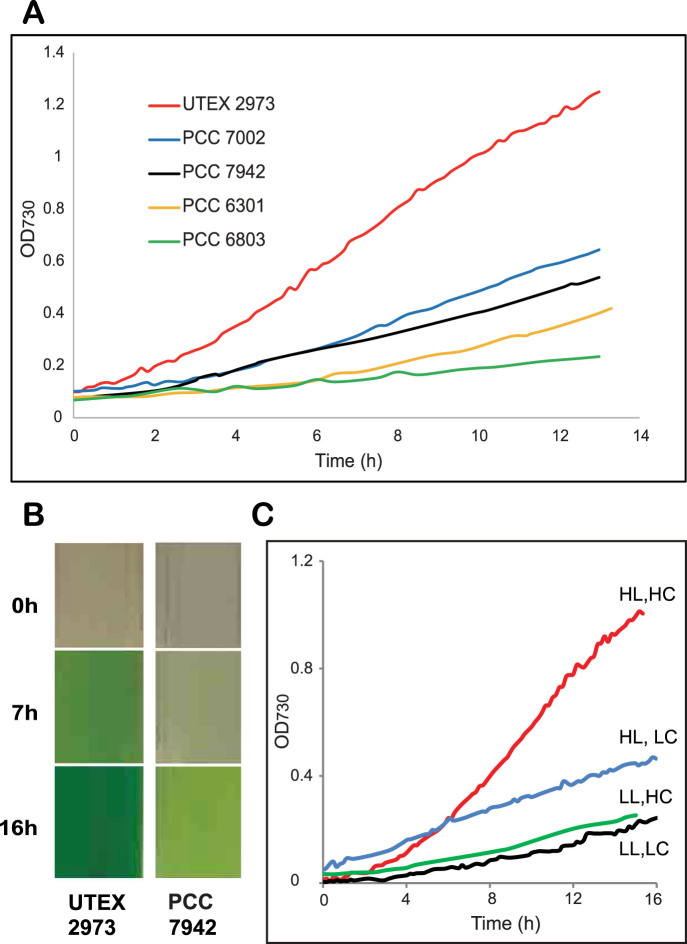
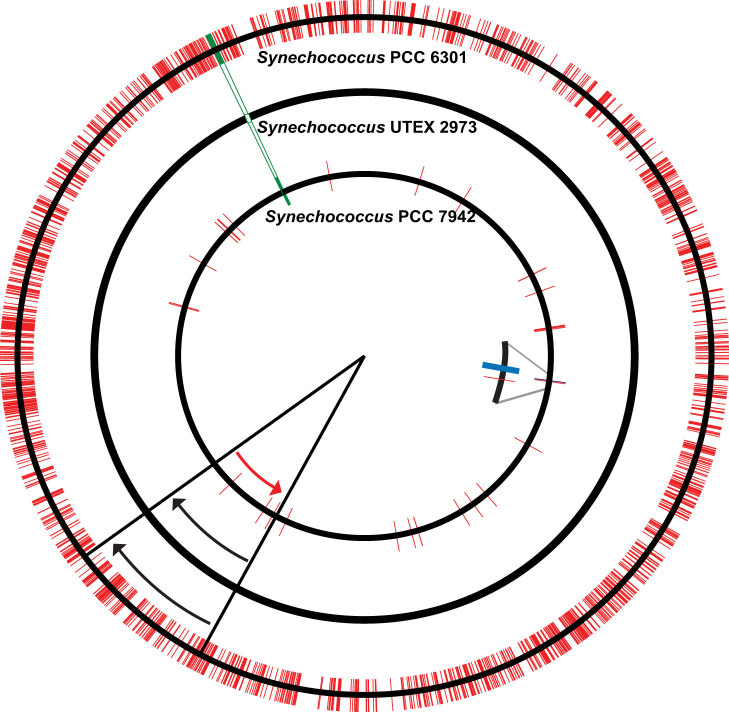
Photosynthetic microbes are of emerging interest as production organisms in biotechnology because they can grow autotrophically using sunlight, an abundant energy source, and CO₂, a greenhouse gas. Important traits for such microbes are fast growth and amenability to genetic manipulation. Here we describe Synechococcus elongatus UTEX 2973, a unicellular cyanobacterium capable of rapid autotrophic growth, comparable to heterotrophic industrial hosts such as yeast. Synechococcus UTEX 2973 can be readily transformed for facile generation of desired knockout and knock-in mutations. Genome sequencing coupled with global proteomics studies revealed that Synechococcus UTEX 2973 is a close relative of the widely studied cyanobacterium Synechococcus elongatus PCC 7942, an organism that grows more than two times slower. A small number of nucleotide changes are the only significant differences between the genomes of these two cyanobacterial strains. Thus, our study has unraveled genetic determinants necessary for rapid growth of cyanobacterial strains of significant industrial potential.


Conflict of interest statement

The authors declare no competing financial interests.

Figures

Figure 1
Figure 1. Comparison of growth rates of different cyanobacterial strains.
(A) Growth curves of strains under individual optimal conditions. Synechococcus UTEX 2973: 41°C, 500 µmole photons·m−2·s−1; Synechococcus PCC 7002: 38°C, 500 µmole photons·m−2·s−1; Synechococcus PCC 7942: 38°C, 300 µmole photons·m−2·s−1; Synechococcus PCC 6301: 38°C, 500 µmole photons·m−2·s−1; Synechocystis PCC 6803: 30°C, 300 µmole photons·m−2·s−1. All cultures were grown with 3% (v/v) CO2 bubbling. (B) Visual comparison of culture densities of Synechococcus UTEX 2973 and Synechococcus PCC 7942 during a 16 h growth period. (C) Growth curves of Synechococcus UTEX 2973 at 38°C under different conditions. HL (high light): 500 µmole photons·m−2·s−1; LL (low light): 100 µmole photons·m−2·s−1; HC (high CO2, 3%); LC (low CO2, 0.04%). Measurements were made every 10 min. Five replicate growth curves were generated for each strain under indicated conditions, except for Synechocystis PCC 6803, which had two replicates. The representative curves are shown in the figure.
Figure 2
Figure 2. Circular maps comparing related cyanobacterial genomes.
Middle circle, Synechococcus UTEX 2973; outer circle, Synechococcus PCC 6301; inner circle, Synechococcus PCC 7942. (red bar), single nucleotide substitutions and indels compared to Synechococcus UTEX 2973; (green box), deletion; (blue box), insertion. Red and black arrows indicate the opposing orientations of the inverted region.
Figure 3
Figure 3. Ultrastructural comparison of Synechococcus strains.
Electron micrographs of (A) Synechococcus UTEX 2973 and (B) Synechococcus PCC 7942 grown in 3% CO2. Labeled are carboxysomes (C) and thylakoid membranes (T). White arrowheads point to the numerous electron-dense bodies. Bar = 500 nm.
Figure 4
Figure 4. Directed gene manipulation in Synechococcus UTEX 2973.
(A) Light micrographs of WT cells and EYFP-expressing transformants. Shown are brightfield (left column), chlorophyll a fluorescence (middle column), and EYFP fluorescence (right column) images. (B) Color phenotypes of WT and ΔnblA mutant cells. Under sulfur deprivation (BG11-S), WT cells bleached but ΔnblA cells did not. (C) Absorption spectra of WT (blue) and ΔnblA (red) cells. Solid lines, sulfur replete; dashed lines, sulfur deprived. The phycocyanin peak at 625 nm is designated by the arrow. Curves were vertically offset for clarity. (D) Growth curves of WT (blue) and ΔnblA (red) cultures under varying irradiance (green dashed line) to mimic a natural 12 h light/12 h dark cycle.

References

    1. Lu X. A perspective: photosynthetic production of fatty acid-based biofuels in genetically engineered cyanobacteria. Biotechnol Adv 28, 742–746 (2010). - PubMed
    1. Heidorn T. et al. Synthetic biology in cyanobacteria engineering and analyzing novel functions. Methods Enzymol 497, 539–579 (2011). - PubMed
    1. Quintana N., Van der Kooy F., Van de Rhee M. D., Voshol G. P. & Verpoorte R. Renewable energy from cyanobacteria: energy production optimization by metabolic pathway engineering. Appl Microbiol Biot 91, 471–490 (2011). - PMC - PubMed
    1. Knoll A. H. in The Cyanobacteria: Molecular biology, Genomics and Evolution (eds Herrero, A. & Flores, E.) Ch. 1, 1–20 (Caister Academic Press, 2008).
    1. Ono E. & Cuello J. L. Carbon dioxide mitigation using thermophilic cyanobacteria. Biosyst Eng 96, 129–134 (2007).

Publication types

Associated data