. 2015 Sep;22(9):1502-16.
doi: 10.1038/cdd.2014.241. Epub 2015 Jan 30.

Imaging of single cell responses to ER stress indicates that the relative dynamics of IRE1/XBP1 and PERK/ATF4 signalling rather than a switch between signalling branches determine cell survival

Affiliations

Imaging of single cell responses to ER stress indicates that the relative dynamics of IRE1/XBP1 and PERK/ATF4 signalling rather than a switch between signalling branches determine cell survival

F Walter et al. Cell Death Differ. 2015 Sep.

Abstract

An accumulation of misfolded proteins in the endoplasmic reticulum (ER) triggers the unfolded protein response (UPR) mediated via the activation of three transmembrane proteins IRE1, PERK and ATF6. Signalling through these proteins is aimed at enhancing the ER folding capacity and reducing the folding load. If these processes fail to re-establish protein homeostasis within the ER, then cell death prevails via apoptosis. How the shift from pro-survival to pro-apoptotic signalling is regulated remains unclear with both IRE1 and PERK signalling associated with pro-survival as well as pro-apoptotic signalling. To investigate the temporal activation of IRE1 and PERK in live cells and their relationship to cellular fate, we devised single cell reporters for both ER stress signalling branches. SH-SY5Y neural cells stably expressing these fluorescent protein reporter constructs to monitor IRE1-splicing activity and PERK-mediated ATF4-translation were imaged using single cell and high content time lapse live cell microscopy. We could correlate an early onset and attenuation of XBP1 splicing in the IRE1-reporter cells as cytoprotective. Indeed, silencing of IRE1 expression using shRNA inhibited splicing of XBP1 resulting in an early onset of cell death. In contrast, in the PERK-reporter cells, we observed that a slow rate of ATF4-translation and late re-initiation of general translation coincided with cells which were resistant to ER stress-induced cell death. Interestingly, whereas silencing of PERK did not affect overall levels of cell death in response to ER stress, it did increase sensitivity to ER stressors at early time points following treatment. Our results suggest that apoptosis activation in response to ER stress is not caused by a preferential activation of a single UPR branch, or by a switch from one branch to the other. Rather, our data indicated that the relative timing of IRE1 and PERK signalling determines the shift from cell survival to apoptosis.


Figures
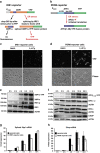
Figure 1
Figure 1
Generation and characterisation of the IRE1- and PERK-reporter cell lines. (a) Schematic depicting the IRE1α reporter construct. Under conditions of ER stress, activation of IRE1α splices Xbp1 mRNA, which enables translation of the in-frame XBP1-YFP reporter fusion protein. In the absence of IRE1α activation, a premature stop codon prevents the translation of the fluorescent protein. (b) Schematic of the PERK-reporter construct. Under ER stress, activated PERK phosphorylates translation initiation factor eIF2α, which initiates translation from the 5′UTR of the YFP-reporter. (c) SH-SY5Y cells stably expressing the IRE1-reporter or (d) the PERK-reporter. Cells were treated with 3 μM Tg (right column) or DMSO for 24 h (left column) and YFP fluorescence imaged (scale bar=20 μM). (e) Expression of ER stress-induced proteins in the IRE1-reporter cell line. Cells were treated with 3 μM Tg and harvested at times indicated. Protein levels were analysed by western blotting and probing with antibodies against XBP1s, which detected the spliced endogenous and reporter XBP1, IRE1 and IRE1-p [Ser724]. β-actin served as loading control. (f) Expression of ER stress-induced proteins in lysates of PERK-reporter cells treated with 3 μM Tm. Protein levels were analysed by western blotting and probing with antibodies against GFP, detecting ATF4(1-28)-YFP, eIF2α, eIF2α-p [Ser51] and CHOP. β-actin served as loading control for both. (g, h) Real-time qPCR analysis of levels of spliced Xbp1 mRNA in IRE1-reporter and parental cells in response to ER stress (g) and Chop mRNA in PERK-reporter and parental cells (h). Cells were treated with 3 μM Tm and harvested at the indicated times. Results were normalized to β-actin levels and expressed relative to cultures harvested at 0 h (mean of n=3, error bars indicate S.E.M.). ANOVA was carried out to compare all groups. Post hoc Tukey pairwise comparison found no significant differences between parental and reporter cells at the different time points
Figure 2
Figure 2
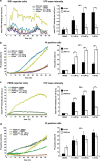
The IRE1 and the PERK reporters are activated in response to ER stress in a concentration-dependent manner. IRE1 reporter cells were stained with Hoechst and PI and treated with varying concentrations of Tm (0.03–1 μM) or Tg (0.03–1 μM) or 0.1% DMSO. Images were taken at 1 h intervals starting immediately after treatment for 48 h. (a) Mean YFP fluorescence intensity per cell over time following treatment with different concentrations of Tm (left panel) or Tg (right panel). Error bars indicate S.E.M. of all cells per time point and treatment. Experiment representative for at least two experiments. (b) Mean YFP fluorescence intensity 16 h after treatment with Tm (left panel) or Tg (right panel). Error bars indicate S.E.M. of at least n=10 wells from at least two independent experiments. ANOVA found significant differences between all treatment groups (P<0.01). Post hoc Tukey pairwise comparison found all Tm/Tg-treated groups to be significantly different from DMSO control (* indicates P<0.01). (c) PERK reporter cells were stained with Hoechst and PI and treated with varying concentrations of Tm (0.03–1 μM) or Tg (0.03–1 μM) or 0.1% DMSO. Images were taken at 1 h intervals starting immediately after treatment for 48 h. Mean YFP fluorescence intensity per cell over time following treatment with Tm (left panel) or Tg (right panel). Error bars indicate S.E.M. of all cells per time point and treatment. Experiment representative for at least two experiments. (d) Mean YFP fluorescence intensity 30 h after treatment with Tm (left panel) or Tg (right panel). Error bars indicate S.E.M. of n=8 wells from two independent experiments. ANOVA found significant differences between all treatment groups (P<0.05). Post hoc Tukey pairwise comparison found all Tm/Tg-treated groups to be significantly different from DMSO control (* indicates P<0.05)
Figure 3
Figure 3
IRE1 silencing resulted in increased sensitivity to ER stress and early onset of cell death whereas PERK gene silencing did not cause higher amounts of cell death. (a) IRE1 reporter cells were transduced with shRNA against IRE1 or scrambled control vector. Ninety-six hours after transduction, the cells were stained with Hoechst and PI and treated with 0.1, 0.3 or 1 μM Tg or 0.1% DMSO. Images were taken at 1 h intervals starting immediately after treatment for 48 h using high content time lapse live cell imaging. Left panel: YFP mean fluorescence intensity in IRE1 reporter cells over time following IRE1-kd or scrambled control group treated with 0.3 μM Tg or 0.1% DMSO, respectively. Error bars indicate S.E.M. of all cells per time point and treatment. Data shown are representative of two experiments. Right panel: YFP mean fluorescence intensity 16 h after treatment with 0.1, 0.3 or 1 μM Tg or 0.1% DMSO. Error bars indicate S.E.M. of n=5 wells from two independent experiments. ANOVA found significant differences between all treatment groups (P<0.05). Post hoc Tukey pairwise comparison between Tg-treated groups and the corresponding DMSO ctrl was significant as indicated (*P<0.05) or IRE1-kd and scrambled control groups treated with the same concentration of Tg (#P<0.05). (b) Left panel: Percentage of PI-positive cells in IRE1 reporter cells over time in IRE1-kd or scrambled control group treated with 0.3 μM Tg or 0.1% DMSO, respectively. Error bars indicate S.E.M. of n=3 wells. Data shown are representative for two experiments. Right panel: Percentage of PI-positive cells 30 h after treatment with 0.1, 0.3 or 1 μM Tg or 0.1% DMSO. Error bars indicate S.E.M. of n=5 wells from two independent experiments. ANOVA found significant differences between all treatment groups (P<0.05). Post hoc Tukey pairwise comparison between Tg-treated groups and the corresponding DMSO ctrl was significant as indicated (*P<0.05) or IRE1-kd and scrambled control groups treated with the same concentration of Tg (#P<0.05). (c) PERK reporter cells were transduced with shRNA against PERK or scrambled control vector. Treatment and imaging was carried out as above. Left panel: YFP mean fluorescence intensity over time in PERK-kd or scrambled control group treated with 0.3 μM Tg or 0.1% DMSO, respectively. Error bars indicate S.E.M. of all cells per time point and treatment. Data shown are representative of four experiments. Right panel: YFP mean fluorescence intensity 30 h after treatment with 0.1, 0.3 or 1 μM Tg or 0.1% DMSO. Error bars indicate S.E.M. of n=9 wells from four independent experiments. ANOVA found significant differences between all treatment groups (P<0.05). Post hoc Tukey pairwise comparison between Tg-treated groups and the corresponding DMSO ctrl was significant as indicated (*P<0.05) or PERK-kd and scrambled control groups treated with with the same concentration of Tg (#P<0.05). (d) Left panel: Percentage of PI-positive cells over time in PERK-kd or scrambled control group treated with 0.3 μM Tg or 0.1% DMSO, respectively. Error bars indicate S.E.M. of n=2 wells. Data shown are representative for four experiments. Right panel: Percentage of PI-positive cells 45 h after treatment with 0.1, 0.3 or 1 μM Tg or 0.1% DMSO. Error bars indicate S.E.M. of n=9 wells from four independent experiments. ANOVA found significant differences between all treatment groups (P<0.05). Post hoc Tukey pairwise comparison between Tg-treated groups and the corresponding DMSO ctrl was significant as indicated (*P<0.05) or PERK-kd and scrambled control groups treated with the same concentration of Tg (#P<0.05)
Figure 4
Figure 4
Single cell time lapse imaging of IRE1 reporter cells. Cells were stained with Hoechst and PI and treated with 3 μM Tm or DMSO and imaged live on stage. Images were acquired every 10 min for 48 h using the Axiovert 200M epi-fluorescence microscope. (a) Mean YFP fluorescence intensity of all cells imaged per time point is plotted in response to Tm or DMSO. (b) The number of PI-positive cells after treatment with 3 μM Tm or DMSO is plotted over time. Average number of imaged cells was n=281 in the Tm treatment and n=434 in the DMSO ctrl-treated experiment. Both Tm- and DMSO-treated experiments were repeated at least three times each with similar results. (c) YFP and PI intensities of a single dying cell measured over time. Black arrows and times correspond to images in panel e below. (d) YFP and PI intensities of a single resistant cell measured over time. (e) Phase, Hoechst, YFP and PI images for selected time points: before increase of fluorescence intensity (5 h), during increase in YFP fluorescence intensity (10 h), time of maximum YFP fluorescence intensity (13 h), decreasing YFP fluorescence intensity (25 h), no YFP fluorescence intensity detectable (36 h), cell death marked by increase in Hoechst intensity caused by condensation of the nucleus and increase in PI intensity marking cell membrane permeabilisation (42 and 42.6 h). Yellow arrows indicate the cell of interest which was tracked. (Scale bar=20 μM). Experiment was repeated twice with similar results
Figure 5
Figure 5
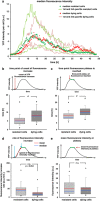
IRE1 reporter cells resistant to ER stress showed earlier onset of fluorescence increase and reached a fluorescence intensity plateau earlier than dying cells. Parameters of IRE1 reporter activation kinetics in response to ER stress measured in individual cells in relation to cellular outcome. IRE1 reporter were cells stained with Hoechst and PI were treated with 3 μM Tm and images acquired every 10 min for 48 h. PI-positive or PI-negative cells were randomly chosen and tracked. (a) Median YFP fluorescence intensity of the traces of surviving (green diamonds) or dying cells (red diamonds) were plotted over time. Resistant cells n=30, dying cells n=31, from three independent experiments. (b-e) YFP-traces were analysed and the following curve parameters as indicated in the schematics above the box plots were compared between dying and resistant cells: (b) Time point of onset of increase in fluorescence intensity (resistant cells n=27, dying cells n=31). (c) Time point the fluorescence intensity stops to increase and a plateau is reached (resistant cells n=30, dying cells n=31). (d) Rate of fluorescence intensity increase (resistant cells n=27, dying cells n=31). (e) Mean fluorescence intensity reached at plateau (resistant cells n=30, dying cells n=31). Mean is indicated as red and median as blue line. Top and bottom of boxes represent 25th and 75th percentile, respectively. Whiskers refer to 10th and 90th percentile and outliers are shown as dots. Mann-Whitney Rank Sum tests were performed to compare the median of resistant and dying groups, #P<0.05, n.s. P >0.05
Figure 6
Figure 6
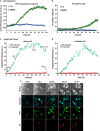
Single cell time lapse imaging of PERK-reporter cells. Cells were stained with Hoechst and PI and treated with 3 μM Tm or 0.1% DMSO. Images were taken every 10 min for 48 h using the Axiovert 200M epi-fluorescence microscope. (a) Mean YFP fluorescence intensity of all cells imaged per time point in response to Tm or DMSO. (b) Amount of PI-positive cells after treatment with 3 μM Tm or 0.1% DMSO. Average number of imaged cells was n=271 in the Tm treatment and n=205 in the DMSO ctrl-treated experiment. Both Tm- and DMSO-treated experiments were repeated at least three times each with similar results. (c) YFP and PI intensities of a dying single cell measured over time. Black arrows and times correspond to images in panel e. (d) YFP and PI intensities of a resistant single cell measured over time. (e) Phase contrast, Hoechst, YFP and PI images for selected time points: baseline YFP fluorescence intensity before onset of increase (0.6 h), during increase in YFP fluorescence intensity (10 h), time of YFP fluorescence intensity plateau (32.6 h), cell death marked by increase in Hoechst and PI intensity (47.5 and 47.7 h). Yellow arrows indicate the cell of interest which was tracked. (Scale bar=20 μM). Experiment was repeated twice with similar results
Figure 7
Figure 7
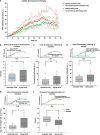
PERK reporter cells resistant to ER stress showed slower rate of fluorescence intensity increase and reached a fluorescence intensity plateau later than dying cells. Parameters of PERK reporter activation kinetics in response to ER stress measured in individual cells in relation to cellular outcome. PERK reporter were cells stained with Hoechst and PI and treated with 3 μM Tm. Images were taken every 10 min for 48 h. PI-positive or PI-negative cells were randomly chosen and tracked. (a) Median YFP fluorescence intensity of the traces of surviving (green triangles) or dying cells (red diamonds) were plotted over time. Resistant cells n=30, dying cells n=32, from three independent experiments. (b-f) YFP traces were analysed and the following curve parameters as indicated in the schematics above the box plots were compared between dying and resistant cells: (b) Time point of onset of increase in fluorescence intensity (resistant cells n=30, dying cells n=28). (c) Mean fluorescence intensity at baseline (resistant cells n=29, dying cells n=28). (d) Mean fluorescence intensity at plateau (resistant cells n=29, dying cells n=28). (e) Rate of fluorescence intensity increase (resistant cells n=32, dying cells n=30). (f) Time point fluorescence intensity plateau is reached (resistant cells n=30, dying cells n=30). Mean is indicated as red and median as blue line. Top and bottom of boxes represent 25th and 75th percentile, respectively. Whiskers refer to 10th and 90th percentile and outliers are shown as dots. Mann-Whitney rank sum tests were performed to compare the median of resistant and dying groups, #P<0.05, n.s. P>0.05
Figure 8
Figure 8
Assumed kinetics of XBP1 splicing and ATF4 translation in response to Tm-induced ER stress in a resistant and a dying cell. In a hypothetically resistant cell, IRE1 is activated early and spliced XBP1 accumulates quickly, until the IRE1 endonuclease activity is attenuated at a relatively early time point, whereas ATF4 translation would occur at a slow rate and dephosphorylation of eIF2α occurs late (Top panel). In a dying cell, XBP1 splicing starts late and occurs at a slow rate, whereas ATF4 accumulates fast and general translation is re-initated early (bottom panel)

References

    1. Calfon M, Zeng H, Urano F, Till JH, Hubbard SR, Harding HP, et al. IRE1 couples endoplasmic reticulum load to secretory capacity by processing the XBP-1 mRNA. Nature. 2002;415:92–96. - PubMed
    1. Lee AH, Iwakoshi NN, Glimcher LH. XBP-1 regulates a subset of endoplasmic reticulum resident chaperone genes in the unfolded protein response. Mol Cell Biol. 2003;23:7448–7459. - PMC - PubMed
    1. Jonikas MC, Collins SR, Denic V, Oh E, Quan EM, Schmid V, et al. Comprehensive characterization of genes required for protein folding in the endoplasmic reticulum. Science. 2009;323:1693–1697. - PMC - PubMed
    1. Hollien J, Weissman JS. Decay of endoplasmic reticulum-localized mRNAs during the unfolded protein response. Science. 2006;313:104–107. - PubMed
    1. Hollien J, Lin JH, Li H, Stevens N, Walter P, Weissman JS. Regulated Ire1-dependent decay of messenger RNAs in mammalian cells. J Cell Biol. 2009;186:323–331. - PMC - PubMed

Publication types

MeSH terms