. 2014 Dec 3;15(12):534.
doi: 10.1186/s13059-014-0534-8.

Prioritizing causal disease genes using unbiased genomic features

Prioritizing causal disease genes using unbiased genomic features

Rahul C Deo et al. Genome Biol. .

Abstract

Background: Cardiovascular disease (CVD) is the leading cause of death in the developed world. Human genetic studies, including genome-wide sequencing and SNP-array approaches, promise to reveal disease genes and mechanisms representing new therapeutic targets. In practice, however, identification of the actual genes contributing to disease pathogenesis has lagged behind identification of associated loci, thus limiting the clinical benefits.

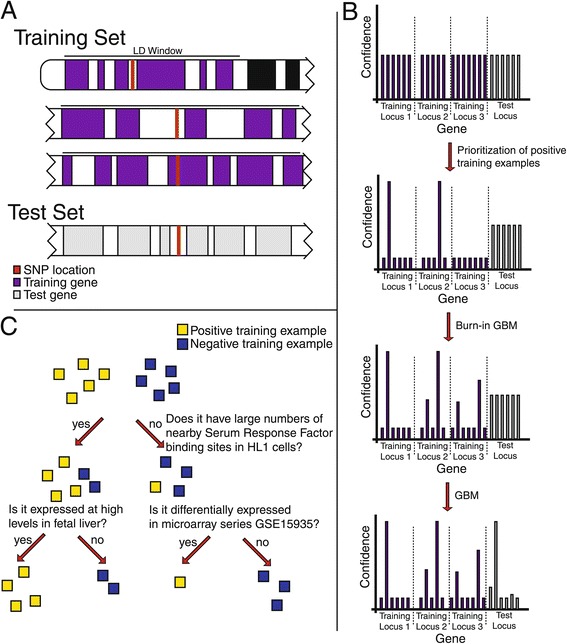
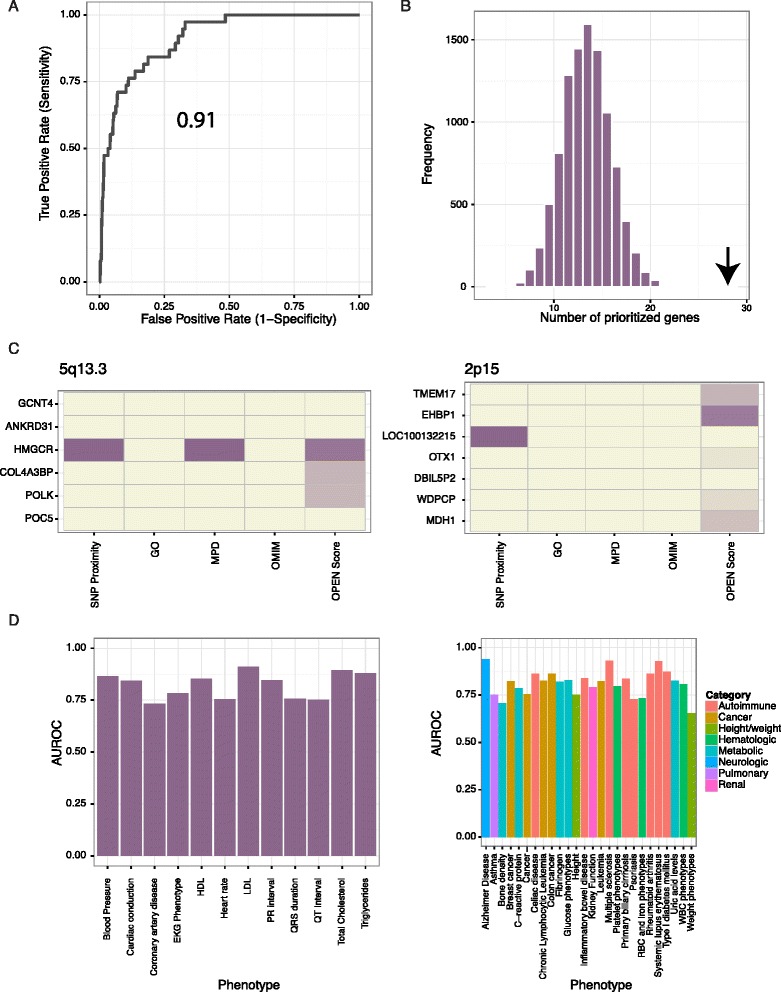
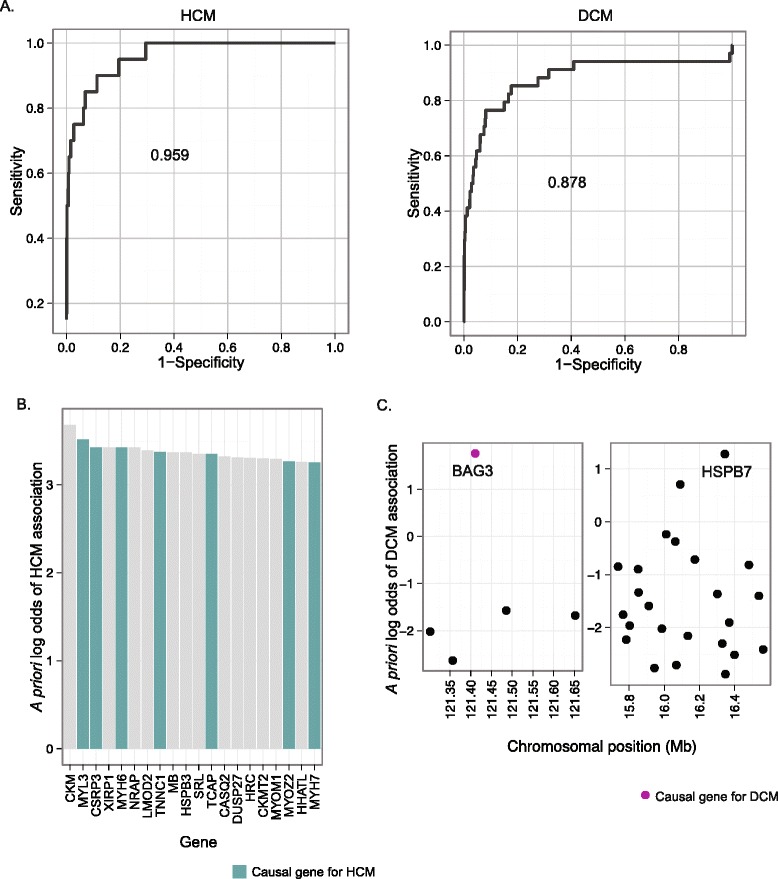
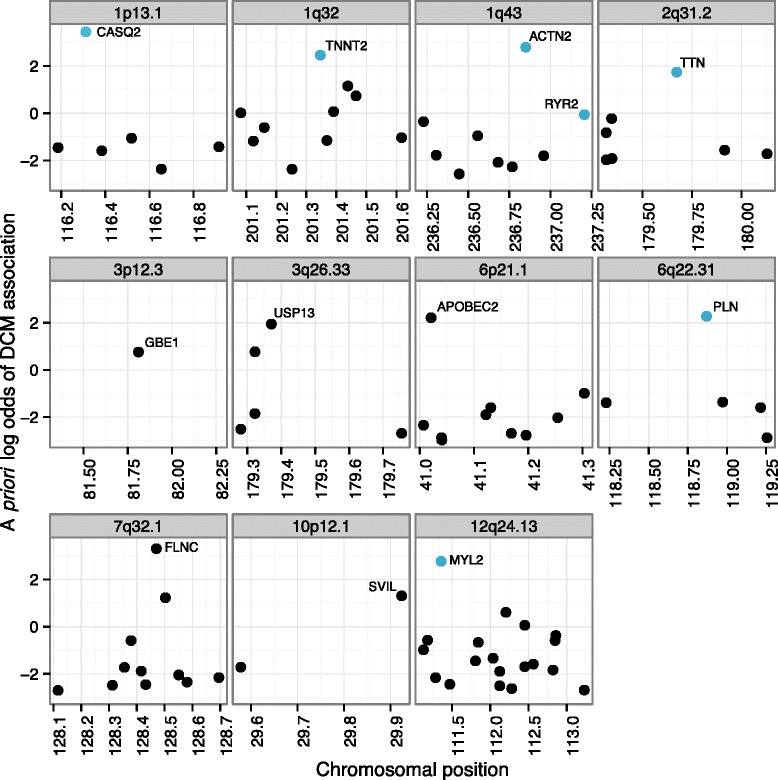
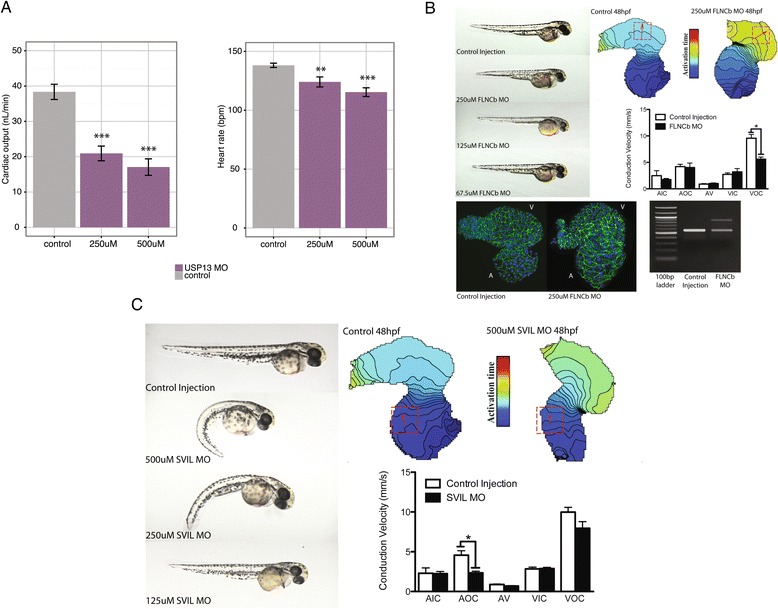
Results: To aid in localizing causal genes, we develop a machine learning approach, Objective Prioritization for Enhanced Novelty (OPEN), which quantitatively prioritizes gene-disease associations based on a diverse group of genomic features. This approach uses only unbiased predictive features and thus is not hampered by a preference towards previously well-characterized genes. We demonstrate success in identifying genetic determinants for CVD-related traits, including cholesterol levels, blood pressure, and conduction system and cardiomyopathy phenotypes. Using OPEN, we prioritize genes, including FLNC, for association with increased left ventricular diameter, which is a defining feature of a prevalent cardiovascular disorder, dilated cardiomyopathy or DCM. Using a zebrafish model, we experimentally validate FLNC and identify a novel FLNC splice-site mutation in a patient with severe DCM.

Conclusion: Our approach stands to assist interpretation of large-scale genetic studies without compromising their fundamentally unbiased nature.


Figures

Figure 1
Figure 1
A decision tree-based approach for causal gene prediction. (A) Mapping of SNPs to neighboring genes using a combination of linkage disequilibrium (LD) information and the location of recombination hotspots. (B) Workflow applying OPEN for causal gene prediction at GWA loci. GWA loci are represented by horizontal bars with individual genes represented by vertical bars. The bar height represents the probability that a gene is causal for the phenotype of interest. Initially, all probabilities are equal. Probabilities are then preliminarily updated based on physical distance from index variant or, optionally, if any prior experimental evidence links them to the phenotype of interest. These probabilities are used in the sampling of positive training examples at each locus during the construction of decision trees. After a 'burn-in' phase, only genes meeting a probability threshold are used as positive training examples. Through cross-validation, the output of the analysis is the log-odds of disease association for all genes in the genome. GBM, gradient boosting machine. (C) Representation of a sample decision tree used for partitioning positive and negative training examples. A classifier consists of multiple decision trees combined in an additive manner.
Figure 2
Figure 2
OPEN successfully prioritizes causal genes for complex traits. (A) Receiver operating characteristic (ROC) curves for prioritization of 'likely positive' genes for LDL-cholesterol. (B) OPEN effectively prioritizes likely positives for low-density lipoprotein (LDL)-cholesterol within GWA loci. A histogram shows the distribution of the number of genes prioritized by random chance over 10,000 independent simulations, with arrow indicating the number prioritized by OPEN (P < 0.0001). (C) OPEN successfully prioritizes the statin target HMGCR at the 5q13.3 locus (left). A heatmap depicts the six genes at the LDL-associated 5q13.3 locus, with the first four columns indicating which genes are near the index variant, and which have been annotated with prior evidence via the Gene Ontology (GO), Mouse Phenotype Database (MPD) or through the Online Mendelian Inheritance in Man (OMIM) database. The final column depicts the OPEN score, with color scheme from beige to dark purple indicating increasing magnitude of the log odds for disease association provided by OPEN. At the 2p15 LDL-associated locus (right), OPEN ranks the un-annotated EHBP1 gene highest. (D) Area under the ROC curve (AUROC) values for cardiac (left) and non-cardiac phenotypes (right). EKG, electrocardiogram; HDL, high-density lipoprotein.
Figure 3
Figure 3
OPEN successfully predicts cardiomyopathy genes. (A) ROC curves for hypertrophic cardiomyopathy (HCM, left) and dilated cardiomyopathy (DCM, right). (B) Top ranked genes according to OPEN score for HCM. Log-odds of disease association are obtained through cross-validation. Blue bars represent positive training examples. (C) OPEN scores for DCM (as a Mendelian disease) are useful for prioritizing genes at DCM GWA loci. Each locus is represented by a scatter plot of OPEN score against chromosomal position, with every gene at the locus represented by a circle. Gene symbols for top ranked genes are provided. Purple coloring indicates that BAG3 has already been implicated in a Mendelian form of DCM.
Figure 4
Figure 4
OPEN scores for DCM successfully prioritize genes at loci identified through a GWA study for left ventricular diameter (LVD). OPEN scores for DCM were mapped to genes at loci marginally associated with LVD (P < 5 × 10-5). Eleven loci have a high-scoring top-ranked gene based on OPEN scores for DCM association. Blue coloring indicates the seven genes are mutated in Mendelian forms of cardiac disease, including DCM, HCM, arrhythmogenic right ventricular cardiomyopathy and catecholaminergic polymorphic ventricular tachycardia (P = 8 × 10-5 for enrichment).
Figure 5
Figure 5
OPEN prioritized genes contribute to cardiac phenotypes in zebrafish. (A) Knockdown of USP13 caused a dose-dependent decrease in cardiac output, due to both a decrease in heart rate and ventricular stroke volume. (B) Injection of a morpholino (MO) targeting a specific splicing event in FLNCb (see Materials and methods) caused apparent cardiac-specific defects. Images on the right show embryos at 48 hours post-fertilization (hpf) with decreasing injected morpholino concentration. Optical mapping confirmed a significant decrease in cardiac conduction velocity in isolated hearts following FLNCb splice inhibition (top right: isochronal maps on right, red box indicates measured region of interest, isochrones are 5 ms apart). Conduction velocity was unaltered in other regions of the heart (middle right: bar graph, regions examined were atrial inner curvature (AIC), atrial outer curvature (AOC), AV node (AV), ventricular inner curvature (VIC), and ventricular outer curvature (VOC)). Additionally, FLNCb splice inhibition resulted in increased atrial cardiomyocyte size (bottom left: beta-catenin stained in green, DAPI in blue, V and A denote ventricle and atria, respectively). RT-PCR confirmed inhibition of the predicted splicing event in FLNCb (bottom right). (C) Knockdown of SVIL causes cardiac edema as well as noticeable spinal curvature at higher morhpolino doses, with only cardiac edema notable at lower doses. Images on left again show decreasing morpholino dose at 48 hpf. Optical mapping (right) confirmed a significant decrease in atrial conduction velocity following SVIL knockdown. ***P < 0.001, **P < 0.01, *P < 0.05.

References

    1. Altshuler D, Daly MJ, Lander ES. Genetic mapping in human disease. Science. 2008;322:881–888. doi: 10.1126/science.1156409. - DOI - PMC - PubMed
    1. Klein RJ, Zeiss C, Chew EY, Tsai J-Y, Sackler RS, Haynes C, Henning AK, SanGiovanni JP, Mane SM, Mayne ST, Bracken MB, Ferris FL, Ott J, Barnstable C, Hoh J. Complement factor H polymorphism in age-related macular degeneration. Science. 2005;308:385–389. doi: 10.1126/science.1109557. - DOI - PMC - PubMed
    1. Ricklin D, Lambris JD. Complement-targeted therapeutics. Nat Biotechnol. 2007;25:1265–1275. doi: 10.1038/nbt1342. - DOI - PMC - PubMed
    1. Ioannidis JPA, Thomas G, Daly MJ. Validating, augmenting and refining genome-wide association signals. Nat Rev Genet. 2009;10:318–329. doi: 10.1038/nrg2544. - DOI - PMC - PubMed
    1. Cooper GM, Shendure J. Needles in stacks of needles: finding disease-causal variants in a wealth of genomic data. Nat Rev Genet. 2011;12:628–640. doi: 10.1038/nrg3046. - DOI - PubMed

Publication types

Associated data