

Effect of empagliflozin monotherapy on postprandial glucose and 24-hour glucose variability in Japanese patients with type 2 diabetes mellitus: a randomized, double-blind, placebo-controlled, 4-week study
- PMID: 25633683
- PMCID: PMC4339254
- DOI: 10.1186/s12933-014-0169-9
Effect of empagliflozin monotherapy on postprandial glucose and 24-hour glucose variability in Japanese patients with type 2 diabetes mellitus: a randomized, double-blind, placebo-controlled, 4-week study
Abstract
Background: This study evaluated the effect of empagliflozin on postprandial glucose (PPG) and 24-hour glucose variability in Japanese patients with type 2 diabetes mellitus (T2DM).
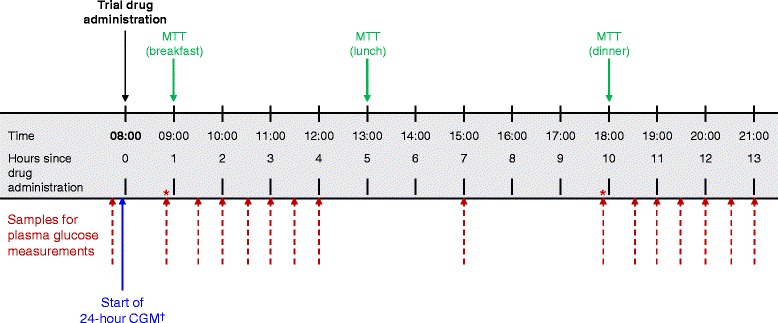
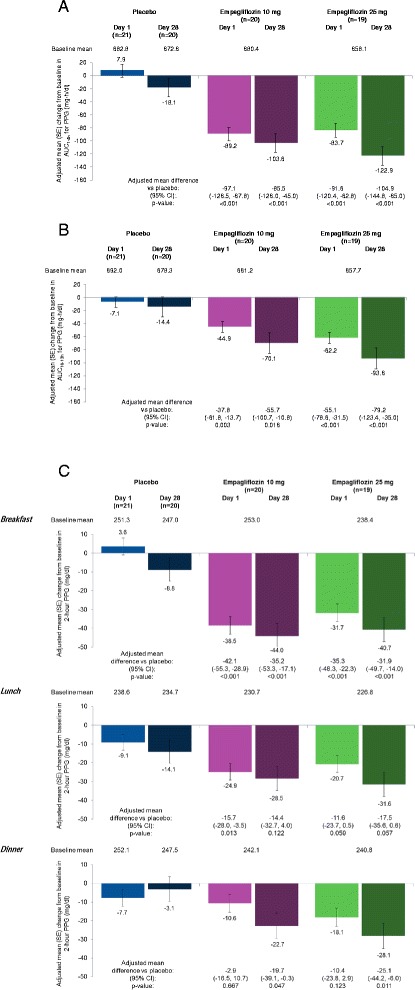
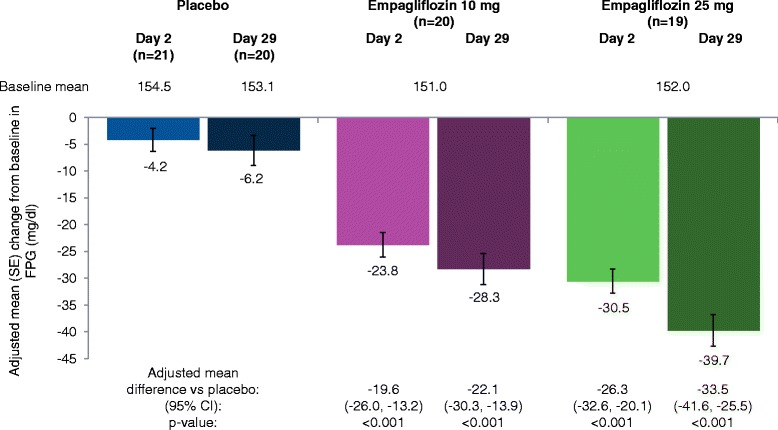
Methods: Patients (N = 60; baseline mean [SD] HbA1c 7.91 [0.80]%; body mass index 24.3 [3.2] kg/m(2)) were randomized to receive empagliflozin 10 mg (n = 20), empagliflozin 25 mg (n = 19) or placebo (n = 21) once daily as monotherapy for 28 days. A meal tolerance test and continuous glucose monitoring (CGM) for 24 hours were performed at baseline and on days 1 and 28. The primary endpoint was change from baseline in area under the glucose concentration-time curve 3 hours after breakfast (AUC1-4h for PPG) at day 28.
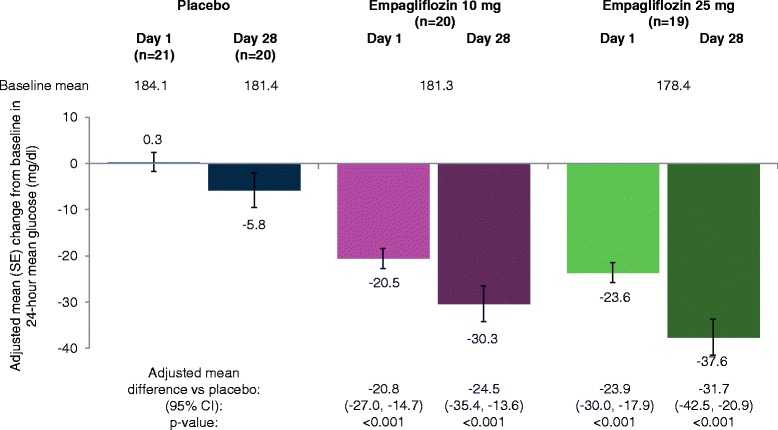
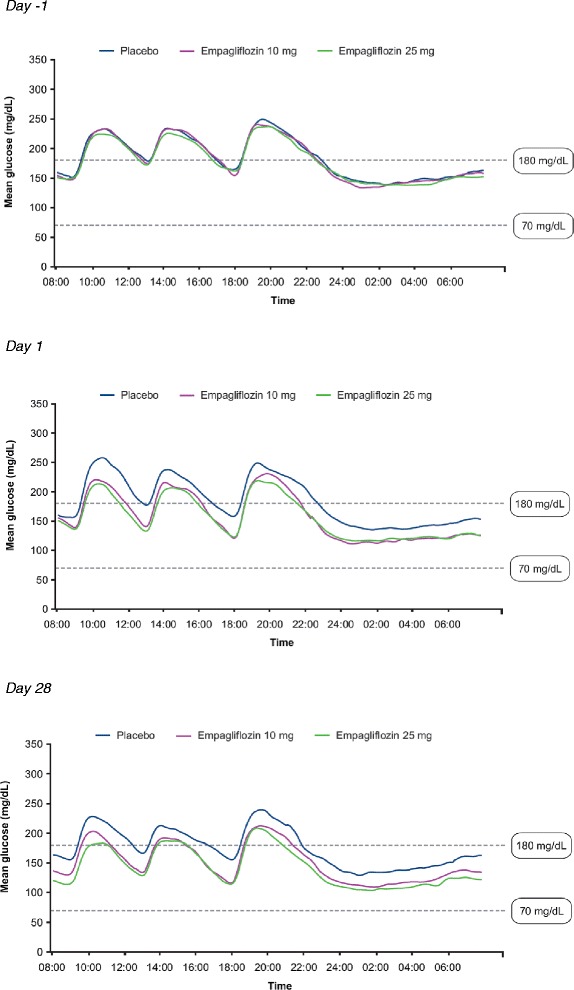
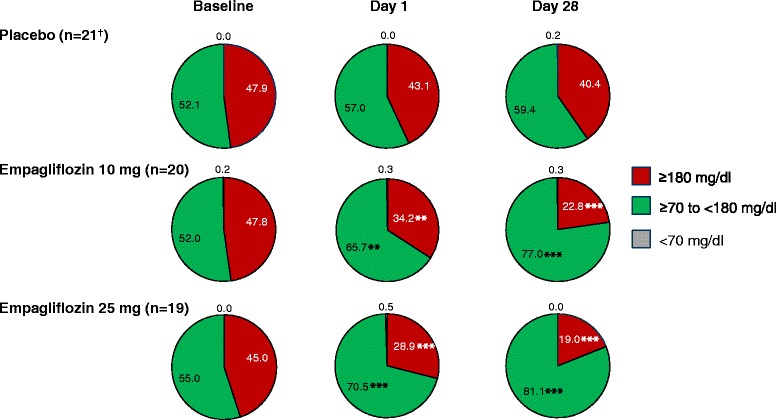
Results: Adjusted mean (95%) differences versus placebo in changes from baseline in AUC1-4h for PPG at day 1 were -97.1 (-126.5, -67.8) mg · h/dl with empagliflozin 10 mg and -91.6 (-120.4, -62.8) mg · h/dl with empagliflozin 25 mg (both p < 0.001 versus placebo) and at day 28 were -85.5 (-126.0, -45.0) mg · h/dl with empagliflozin 10 mg and -104.9 (-144.8, -65.0) mg · h/dl with empagliflozin 25 mg (both p < 0.001 versus placebo). Adjusted mean (95% CI) differences versus placebo in change from baseline in 24-hour mean glucose (CGM) at day 1 were -20.8 (-27.0, -14.7) mg/dl with empagliflozin 10 mg and -23.9 (-30.0, -17.9) mg/dl with empagliflozin 25 mg (both p < 0.001 versus placebo) and at day 28 were -24.5 (-35.4, -13.6) mg/dl with empagliflozin 10 mg and -31.7 (-42.5,-20.9) mg/dl with empagliflozin 25 mg (both p < 0.001 versus placebo). Changes from baseline in mean amplitude of glucose excursions (MAGE; CGM) were not significantly different with either empagliflozin dose versus placebo at either timepoint. Curves of mean glucose (CGM) did not change between baseline and day 1 or 28 with placebo, but shifted downward with empagliflozin. Percentage of time with glucose ≥70 to <180 mg/dl increased from 52.0% at baseline to 77.0% at day 28 with empagliflozin 10 mg and from 55.0% to 81.1% with empagliflozin 25 mg, without increasing time spent with hypoglycemia.
Conclusion: Empagliflozin for 28 days reduced PPG from the first day and improved daily blood glucose control in Japanese patients with T2DM.
Trial registration: Clinicaltrials.gov NCT01947855.
Figures
References
-
- Oba S, Nagata C, Nakamura K, Takatsuka N, Shimizu H. Self-reported diabetes mellitus and risk of mortality from all causes, cardiovascular disease, and cancer in Takayama: a population-based prospective cohort study in Japan. J Epidemiol. 2008;18(5):197–203. doi: 10.2188/jea.JE2008004. - DOI - PMC - PubMed
-
- Bonora E, Calcaterra F, Lombardi S, Bonfante N, Formentini G, Bonadonna RC, Muggeo M. Plasma glucose levels throughout the day and HbA(1c) interrelationships in type 2 diabetes: implications for treatment and monitoring of metabolic control. Diabetes Care. 2001;24(12):2023–2029. doi: 10.2337/diacare.24.12.2023. - DOI - PubMed
-
- Woerle HJ, Neumann C, Zschau S, Tenner S, Irsigler A, Schirra J, Gerich JE, Goke B. Impact of fasting and postprandial glycemia on overall glycemic control in type 2 diabetes: importance of postprandial glycemia to achieve target HbA1c levels. Diabetes Res Clin Pract. 2007;77(2):280–285. doi: 10.1016/j.diabres.2006.11.011. - DOI - PubMed
Publication types
MeSH terms
Substances
Associated data
LinkOut - more resources
Full Text Sources
Other Literature Sources
Medical
