

MicroRNA-93 activates c-Met/PI3K/Akt pathway activity in hepatocellular carcinoma by directly inhibiting PTEN and CDKN1A
- PMID: 25633810
- PMCID: PMC4413648
- DOI: 10.18632/oncotarget.3085
MicroRNA-93 activates c-Met/PI3K/Akt pathway activity in hepatocellular carcinoma by directly inhibiting PTEN and CDKN1A
Abstract
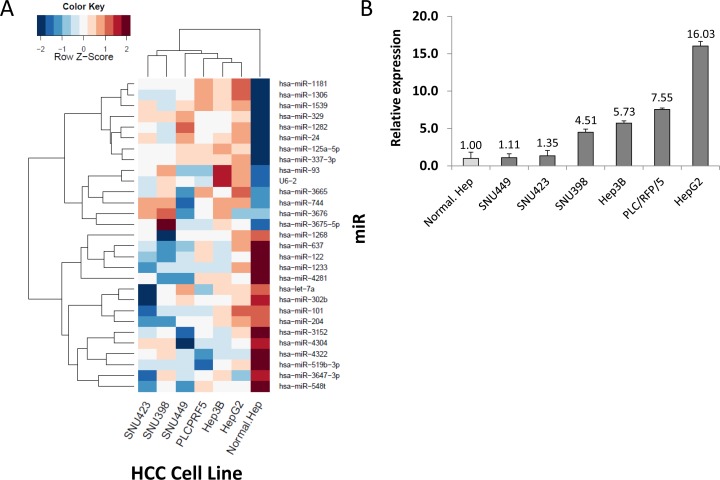
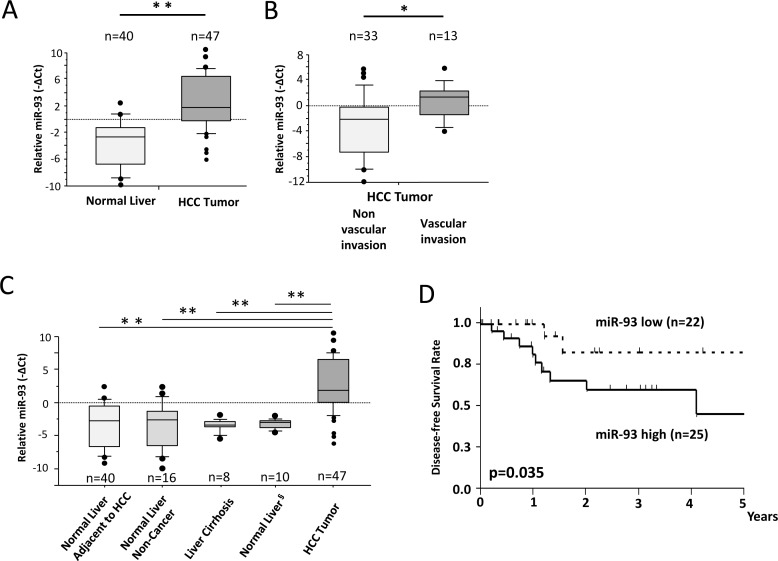
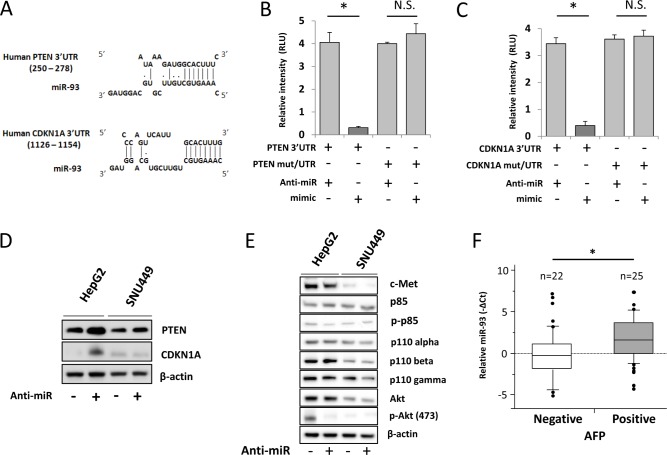
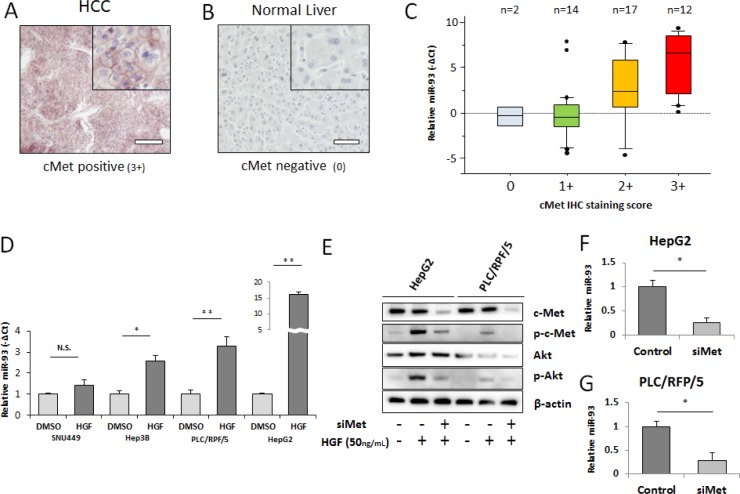
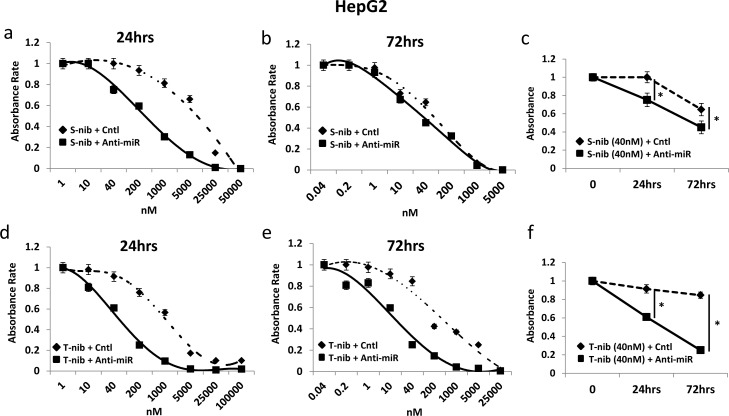
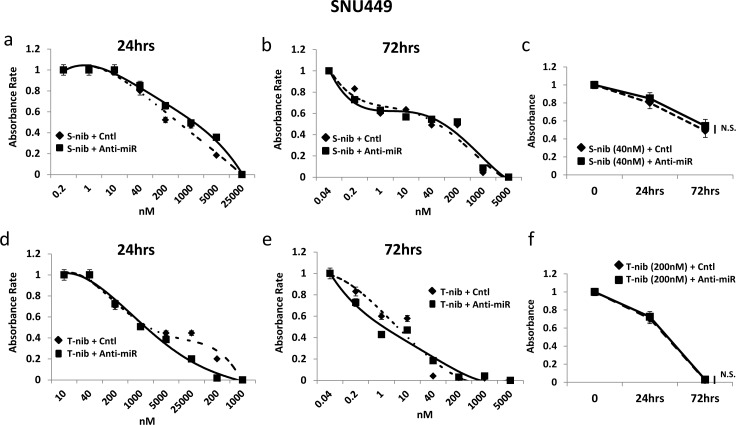
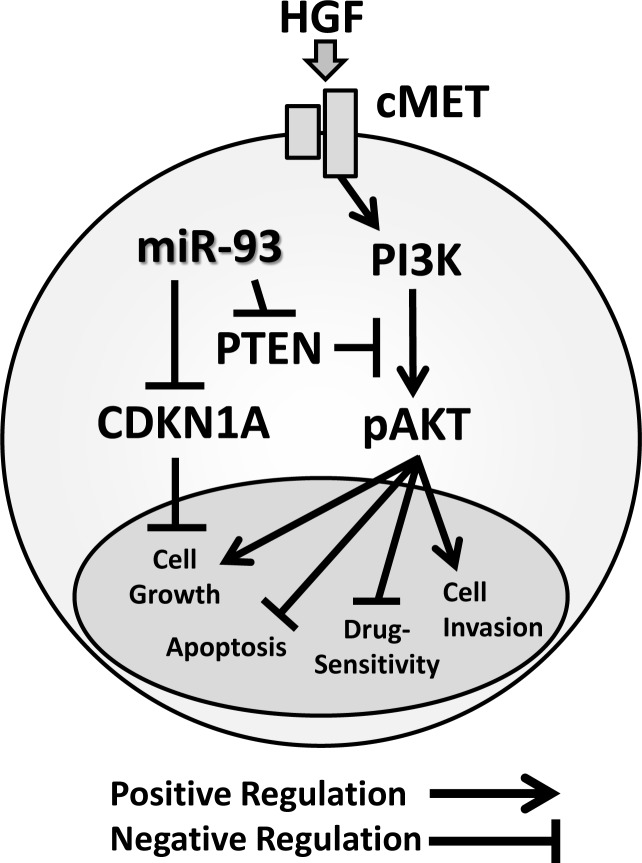
To assess the role of microRNAs (miR) in hepatocellular carcinoma (HCC), we performed comprehensive microRNA expression profiling using HCC cell lines and identified miR-93 as a novel target associated with HCC. We further verified miR-93 expression levels in advanced HCC tumors (n=47) by a direct PCR assay and found that elevated miR-93 expression level is significantly correlated with poor prognosis. Elevated miR-93 expression significantly stimulated in vitro cell proliferation, migration and invasion, and additionally inhibited apoptosis. We confirmed that miR-93 directly bound with the 3' untranslated regions of the tumor-suppressor genes PTEN and CDKN1A, respectively,and inhibited their expression. As a result of this inhibition, the c-Met/PI3K/Akt pathway activity was enhanced. IHC analysis of HCC tumors showed significant correlation between c-Met protein expression levels and miR-93 expression levels. Knockdown of c-Met inhibited the activation of the c-Met/PI3K/Akt pathway regardless of hepatocyte growth factor (HGF) treatment, and furthermore reduced the expression of miR-93 in these HCC cells. miR-93 also rendered cells to be more sensitive to sorafenib and tivantinib treatment. We concluded that miR-93 stimulated cell proliferation, migration, and invasion through the oncogenic c-Met/PI3K/Akt pathway and also inhibited apoptosis by directly inhibiting PTEN and CDKN1A expression in human HCC.
Figures

Similar articles
-
MiR-21 mediates sorafenib resistance of hepatocellular carcinoma cells by inhibiting autophagy via the PTEN/Akt pathway.Oncotarget. 2015 Oct 6;6(30):28867-81. doi: 10.18632/oncotarget.4814. Oncotarget. 2015. PMID: 26311740 Free PMC article.
-
MicroRNA-155-5p promotes hepatocellular carcinoma progression by suppressing PTEN through the PI3K/Akt pathway.Cancer Sci. 2017 Apr;108(4):620-631. doi: 10.1111/cas.13177. Epub 2017 Apr 19. Cancer Sci. 2017. PMID: 28132399 Free PMC article.
-
In hepatocellular carcinoma miR-519d is up-regulated by p53 and DNA hypomethylation and targets CDKN1A/p21, PTEN, AKT3 and TIMP2.J Pathol. 2012 Jul;227(3):275-85. doi: 10.1002/path.3995. Epub 2012 Apr 18. J Pathol. 2012. PMID: 22262409
-
A Bioligical Perspective on the role of miR-206 in Colorectal cancer.Gene. 2025 Aug 15;961:149552. doi: 10.1016/j.gene.2025.149552. Epub 2025 May 6. Gene. 2025. PMID: 40339768 Review.
-
Targeting Akt in Hepatocellular Carcinoma and Its Tumor Microenvironment.Int J Mol Sci. 2021 Feb 11;22(4):1794. doi: 10.3390/ijms22041794. Int J Mol Sci. 2021. PMID: 33670268 Free PMC article. Review.
Cited by
-
A Systematic Review of MicroRNAs Involved in Cervical Cancer Progression.Cells. 2021 Mar 17;10(3):668. doi: 10.3390/cells10030668. Cells. 2021. PMID: 33803022 Free PMC article.
-
MicroRNA-93 promotes the malignant phenotypes of human glioma cells and induces their chemoresistance to temozolomide.Biol Open. 2016 Jun 15;5(6):669-77. doi: 10.1242/bio.015552. Biol Open. 2016. PMID: 27185265 Free PMC article.
-
MicroRNA and liver cancer.Cancer Drug Resist. 2020 Apr 17;3(3):385-400. doi: 10.20517/cdr.2019.110. eCollection 2020. Cancer Drug Resist. 2020. PMID: 35582451 Free PMC article. Review.
-
Identification of a 3,3-difluorinated tetrahydropyridinol compound as a novel antitumor agent for hepatocellular carcinoma acting via cell cycle arrest through disturbing CDK7-mediated phosphorylation of Cdc2.Invest New Drugs. 2020 Apr;38(2):287-298. doi: 10.1007/s10637-019-00792-6. Epub 2019 May 11. Invest New Drugs. 2020. PMID: 31076964
-
Non-Coding RNAs: Regulating Disease Progression and Therapy Resistance in Hepatocellular Carcinoma.Cancers (Basel). 2020 May 15;12(5):1243. doi: 10.3390/cancers12051243. Cancers (Basel). 2020. PMID: 32429062 Free PMC article. Review.
References
-
- Llovet JM, Ricci S, Mazzaferro V, Hilgard P, Gane E, Blanc J-F, de Oliveira AC, Santoro A, Raoul J-L, Forner A. Sorafenib in advanced hepatocellular carcinoma. New England Journal of Medicine. 2008;359(4):378–390. - PubMed
-
- Cheng A-L, Kang Y-K, Chen Z, Tsao C-J, Qin S, Kim JS, Luo R, Feng J, Ye S, Yang T-S. Efficacy and safety of sorafenib in patients in the Asia-Pacific region with advanced hepatocellular carcinoma: a phase III randomised, double-blind, placebo-controlled trial. The lancet oncology. 2009;10(1):25–34. - PubMed
-
- National Comprehensive Cancer Network. NCCN Guidelines Version 2.2014 Hepatobiliary Cancers. www.nccn.org - PubMed
-
- Santoro A, Rimassa L, Borbath I, Daniele B, Salvagni S, Van Laethem JL, Van Vlierberghe H, Trojan J, Kolligs FT, Weiss A. Tivantinib for second-line treatment of advanced hepatocellular carcinoma: a randomised, placebo-controlled phase 2 study. The lancet oncology. 2012 - PubMed
-
- Aravalli RN, Steer CJ, Cressman EN. Molecular mechanisms of hepatocellular carcinoma. Hepatology. 2008;48(6):2047–2063. - PubMed
Publication types
MeSH terms
Substances
LinkOut - more resources
Full Text Sources
Other Literature Sources
Medical
Research Materials
Miscellaneous
