. 2015 Jan 30:5:8140.
doi: 10.1038/srep08140.

Highlighting nonlinear patterns in population genetics datasets

Affiliations

Highlighting nonlinear patterns in population genetics datasets

Gregorio Alanis-Lobato et al. Sci Rep. .

Abstract

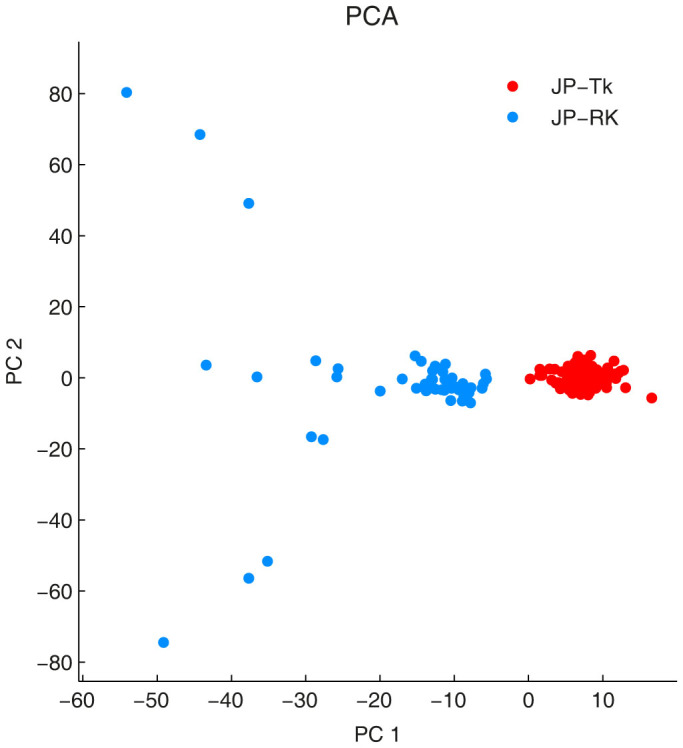
Detecting structure in population genetics and case-control studies is important, as it exposes phenomena such as ecoclines, admixture and stratification. Principal Component Analysis (PCA) is a linear dimension-reduction technique commonly used for this purpose, but it struggles to reveal complex, nonlinear data patterns. In this paper we introduce non-centred Minimum Curvilinear Embedding (ncMCE), a nonlinear method to overcome this problem. Our analyses show that ncMCE can separate individuals into ethnic groups in cases in which PCA fails to reveal any clear structure. This increased discrimination power arises from ncMCE's ability to better capture the phylogenetic signal in the samples, whereas PCA better reflects their geographic relation. We also demonstrate how ncMCE can discover interesting patterns, even when the data has been poorly pre-processed. The juxtaposition of PCA and ncMCE visualisations provides a new standard of analysis with utility for discovering and validating significant linear/nonlinear complementary patterns in genetic data.


Figures

Figure 1
Figure 1. MCE computes distances between individuals (given a selected norm; in our case, the Euclidean norm) in G to generate the matrix of pairwise distances A.
This matrix can be thought of as the adjacency matrix representation of a fully connected graph whose edges are weighted by inter-individual distances. A MST T is extracted from this graph, and distances between individuals are re-computed over it to obtain the MC-kernel D. In this paper, we used a version of MCE in which D is non-centred and the economy-size singular value decomposition is applied to it to determine the coordinates of each individual in a space of dimension d. This version of MCE is also known as ncMCE. The power of this approach relies on the MC-kernel. The MST T is a graph that extracts a greedy path that summarises the main relational information between the features of the dataset. This graph avoids noise and spurious information and emphasises the nonlinear relationship between the most representative and informative features of the data samples.
Figure 2
Figure 2. Linear and nonlinear projections of an artificial dataset.
The correct embedding of the nonlinear clustered points of the artificial dataset presented in (a), requires the application of a nonlinear dimensionality reduction approach, like ncMCE (c), because the nonlinear structure of the data is not properly mapped to the low dimensional space using linear techniques, such as PCA (b). If the 3D shapes are gradually stretched until they form two planes (d), the nonlinear structure of the data is progressively linearised as indicated by an improvement of PCA's clustering quality in (e). Interestingly, while the behaviour of ncMCE is quite stable, giving always a well-defined separation, PCA presents a phase transition in the discrimination measure between the 40% and 50% of the stretching simulation-factor. This is a clear example of the instability of PCA in recovering patterns when it is not known, a priori, whether these patterns are nonlinear (see PCA curve when stretching factor is between 0 and 40%) or quasi-linear (see PCA curve when stretching factor is between 50% and 100%).
Figure 3
Figure 3. PCA and ncMCE complementarity.
(a) PCA (left) provides a clear separation between the Yoruba (YRI), European (CEU) and Asian (CHB and JPT) samples but it is unable to detect the differences between the Chinese and Japanese individuals that form the Asian group. ncMCE (centre) clearly detected this difference over Dim2 and also provided an ordering over this dimension that was related to the organisation of these populations in a phylogenetic tree (right). (b) and (c): PCA (left) scattered the Malay and Singaporean individuals in a geographic manner. ncMCE (centre), just as in (a), clearly detected the genetic differences between individuals by separating ethnic groups over Dim2 and highlighting their phylogenetic relationships (right) over this same dimension. MY-MN and MY-KN are Malay Malay, MY-BD are Malay Bidayuh, MY-TM are Proto-Malay and MY-JH and MY-KS are Malay Negritos. SG-MY are Singaporean of Malay descent, SG-CH are Singaporean of Chinese descent and SG-ID are Singaporean of Indian descent.
Figure 4
Figure 4. ncMCE finds additional patterns in population genetics data.
Although PCA cannot reveal the presence of subgroups within the Japanese population (a), ncMCE clearly revealed defined sub-clusters (b). For the case of the Japanese individuals, we know that this separation is correct because Japanese from Tokyo (JPT & JP-ML) are different from those from Okinawa (JP-RK). This result is clearly revealed by ncMCE (c). The use of a single colour for all individuals in the PCA plot (a) would make it impossible to recognise the presence of the two sub-clusters.
Figure 5
Figure 5. Linearisation of the Japanese dataset by substitution of the missing values.
The missing values in the genotype matrix of Japanese individuals were substituted with the mode of each specific SNP to remove the nonlinear perturbations of this dataset and allow PCA to identify sub-groups, Tokyotas or JP-Tk, and Okinawans or JP-RK, that ncMCE was able to identify using the original data.
Figure 6
Figure 6. Mann–Whitney non-parametric statistical test confirmed ncMCE's sub-cluster detection.
Extraction of the SNPs that most significantly differentiated between members of the sub-groups identified by ncMCE in the Japanese population (p ≤ 0.01) confirmed what ncMCE found: the presence of two sub-groups of individuals with clear genetic differences (a). The heat map shows the log10(1 + SNP value), in which the SNP values can be 0 (homozygous wild-type), 1 (heterozygous wild-type), 2 (homozygous variant type) or 3 (missing data). The SNPs are subdivided in a first set with high average values, in the top-left corner of the heat map, characterising the first cluster of individuals. The second set, in the bottom-right corner, has also high average values and characterises the other cluster. Note that the genetic variants in the first or the last set of SNPs make the two groups genetically different. Interestingly, the PCA projection of the Japanese individuals, which considered only the significant SNPs extracted from the original genotype matrix, revealed the two groups that ncMCE identified (b). PCA could not detect these groups upon application to the original dataset (Fig. 4a).

References

    1. Visscher P. M., Brown M. A., McCarthy M. I. & Yang J. Five years of GWAS discovery. Am. J. Hum. Genet. 90, 7–24 (2012). - PMC - PubMed
    1. Jolliffe I. T. Principal Component Analysis. 489 (Springer, 2002).
    1. Menozzi P., Piazza A. & Cavalli-Sforza L. Synthetic maps of human gene frequencies in Europeans. Science. 201, 786–792 (1978). - PubMed
    1. Patterson N., Price A. L. & Reich D. Population structure and eigenanalysis. PLoS Genet. 2, e190 (2006). - PMC - PubMed
    1. Price A. L. et al. Principal components analysis corrects for stratification in genome-wide association studies. Nat. Genet. 38, 904–909 (2006). - PubMed

Publication types

LinkOut - more resources