

PAV markers in Sorghum bicolour: genome pattern, affected genes and pathways, and genetic linkage map construction
- PMID: 25634103
- PMCID: PMC4361761
- DOI: 10.1007/s00122-015-2458-4
PAV markers in Sorghum bicolour: genome pattern, affected genes and pathways, and genetic linkage map construction
Abstract
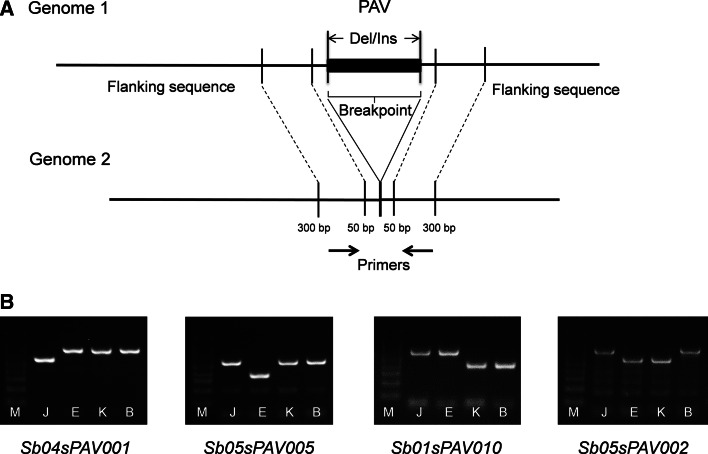
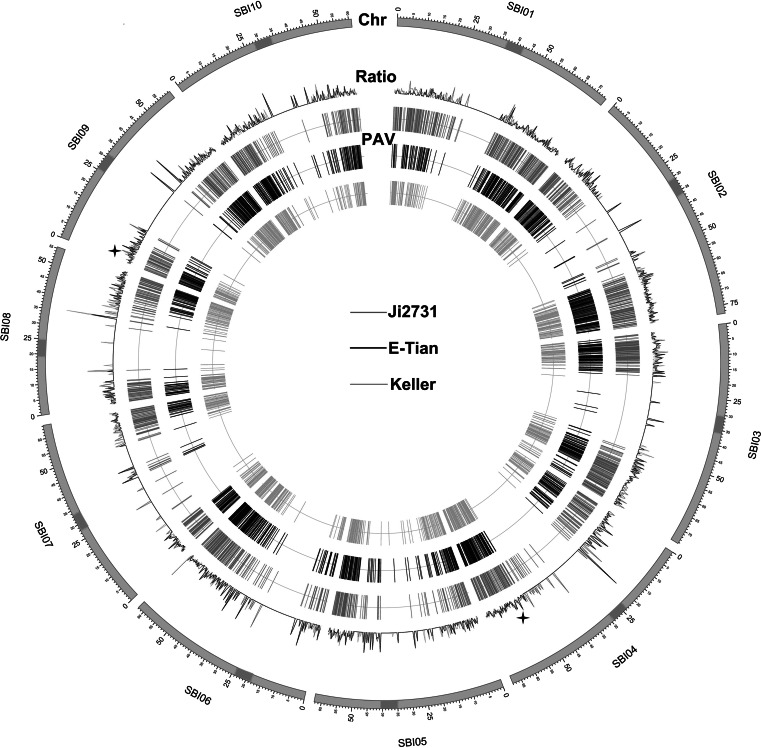
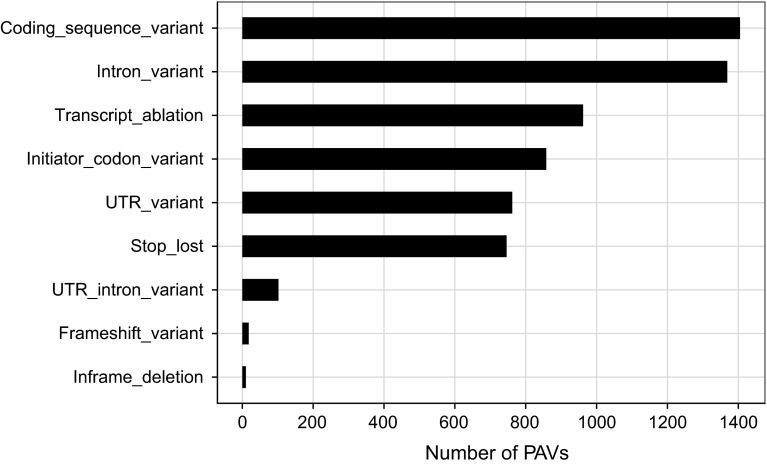
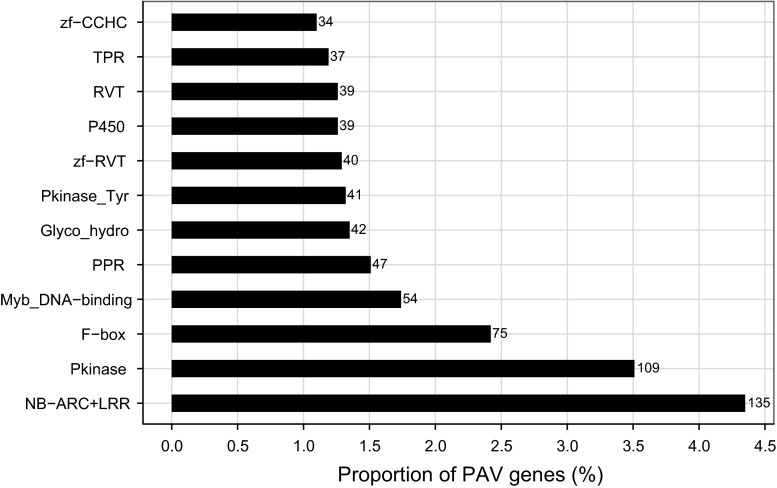
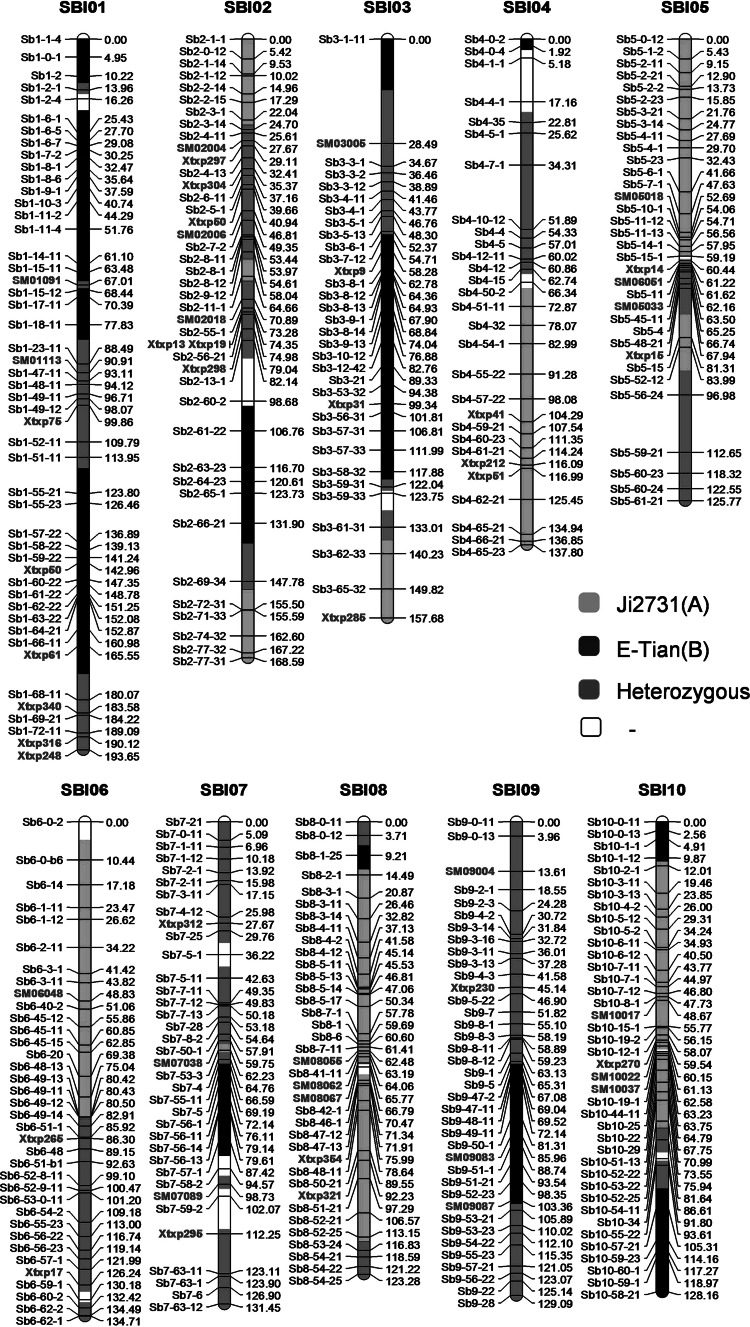
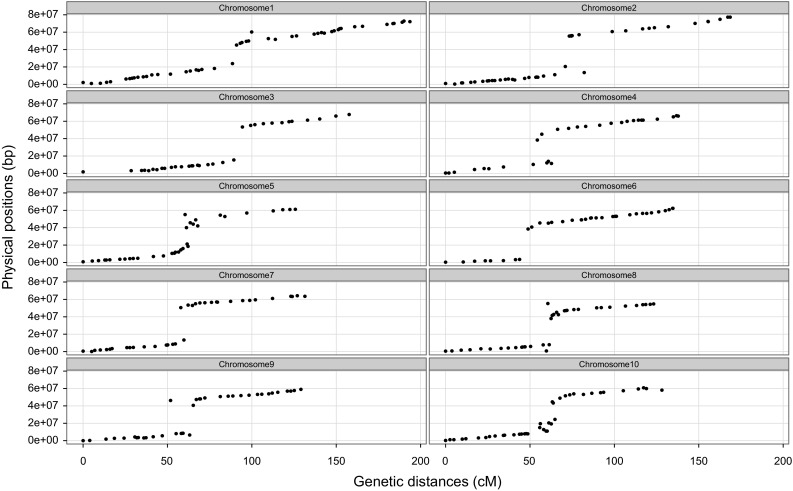
5,511 genic small-size PAVs in sorghum were identified and examined, including the pattern and the function enrichment of PAV genes. 325 PAV markers were developed to construct a genetic map. Presence/absence variants (PAVs) correlate closely to the phenotypic variation, by impacting plant genome sizes and the adaption to the environment. To shed more light on their genome-wide patterns, functions and the possibility of using them as molecular markers, we generated next generation genome sequencing data for four sorghum inbred lines and used associated bioinformatic pipelines to identify small-size PAVs (40-10 kb). Five thousand five hundreds and eleven genic PAVs (40-10 kb) were identified and found to affect 3,238 genes. These PAVs were mainly distributed on the sub-telomeric regions, but the highest proportions occurred in the vicinity of the centromeric regions. One of the prominent features of the PAVs is the high occurrence of long terminal repeats retrotransposons and DNA transposons. PAVs caused various alterations to gene structure, primarily including the coding sequence variants, intron variants, transcript ablation, and initiator codon changes. The genes affected by PAVs were significantly enriched in those involved in stress responses and protein modification. We used 325 PAVs polymorphic between two sorghum inbred lines Ji2731 and E-Tian, together with 49 SSR markers, and constructed a genetic map, which consisted of 10 linkage groups corresponding to the 10 chromosomes of sorghum and spanned 1,430.3 cM in length covering 97% of the physical genome. The resources reported here should be useful for genetic study and breeding of sorghum and related species.
Figures
Similar articles
-
Genome-wide patterns of large-size presence/absence variants in sorghum.J Integr Plant Biol. 2014 Jan;56(1):24-37. doi: 10.1111/jipb.12121. J Integr Plant Biol. 2014. PMID: 24428208
-
A consensus genetic map of sorghum that integrates multiple component maps and high-throughput Diversity Array Technology (DArT) markers.BMC Plant Biol. 2009 Jan 26;9:13. doi: 10.1186/1471-2229-9-13. BMC Plant Biol. 2009. PMID: 19171067 Free PMC article.
-
Sequence analysis of European maize inbred line F2 provides new insights into molecular and chromosomal characteristics of presence/absence variants.BMC Genomics. 2018 Feb 5;19(1):119. doi: 10.1186/s12864-018-4490-7. BMC Genomics. 2018. PMID: 29402214 Free PMC article.
-
Construction of methylation linkage map based on MSAP and SSR markers in Sorghum bicolor (L.).IUBMB Life. 2009 Jun;61(6):663-9. doi: 10.1002/iub.213. IUBMB Life. 2009. PMID: 19472176
-
Association mapping of height and maturity across five environments using the sorghum mini core collection.Genome. 2012 Jun;55(6):471-9. doi: 10.1139/g2012-034. Epub 2012 Jun 8. Genome. 2012. PMID: 22680231
Cited by
-
Stability and genetic control of morphological, biomass and biofuel traits under temperate maritime and continental conditions in sweet sorghum (Sorghum bicolour).Theor Appl Genet. 2015 Sep;128(9):1685-701. doi: 10.1007/s00122-015-2538-5. Epub 2015 May 16. Theor Appl Genet. 2015. PMID: 25982132
-
Sweet Sorghum Originated through Selection of Dry, a Plant-Specific NAC Transcription Factor Gene.Plant Cell. 2018 Oct;30(10):2286-2307. doi: 10.1105/tpc.18.00313. Epub 2018 Oct 11. Plant Cell. 2018. PMID: 30309900 Free PMC article.
-
Genome-wide insertion-deletion (InDel) marker discovery and genotyping for genomics-assisted breeding applications in chickpea.DNA Res. 2015 Oct;22(5):377-86. doi: 10.1093/dnares/dsv020. Epub 2015 Sep 17. DNA Res. 2015. PMID: 26385353 Free PMC article.
-
Pangenome of white lupin provides insights into the diversity of the species.Plant Biotechnol J. 2021 Dec;19(12):2532-2543. doi: 10.1111/pbi.13678. Epub 2021 Sep 17. Plant Biotechnol J. 2021. PMID: 34346542 Free PMC article.
-
The Genetic Basis of Tomato Aroma.Genes (Basel). 2021 Feb 4;12(2):226. doi: 10.3390/genes12020226. Genes (Basel). 2021. PMID: 33557308 Free PMC article. Review.
References
Publication types
MeSH terms
Substances
LinkOut - more resources
Full Text Sources
Other Literature Sources
