. 2015 Apr 1;75(7):1244-54.
doi: 10.1158/0008-5472.CAN-14-1616. Epub 2015 Jan 29.

Tumor Endothelial Cells with Distinct Patterns of TGFβ-Driven Endothelial-to-Mesenchymal Transition

Affiliations

Tumor Endothelial Cells with Distinct Patterns of TGFβ-Driven Endothelial-to-Mesenchymal Transition

Lin Xiao et al. Cancer Res. .

Abstract

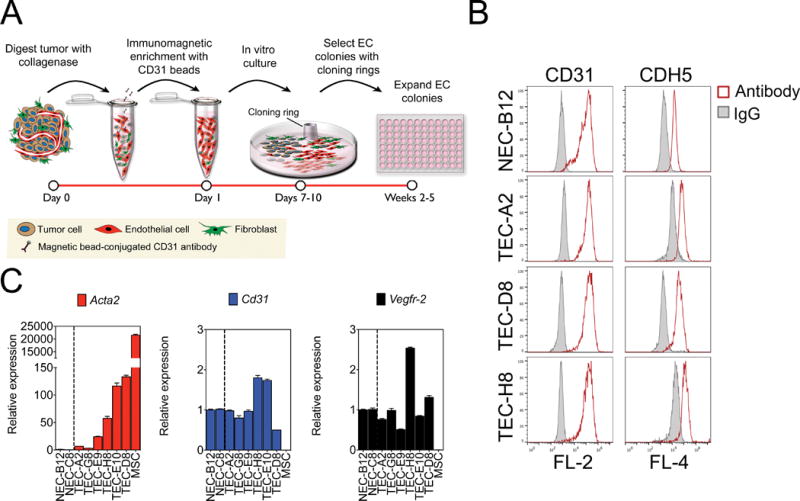
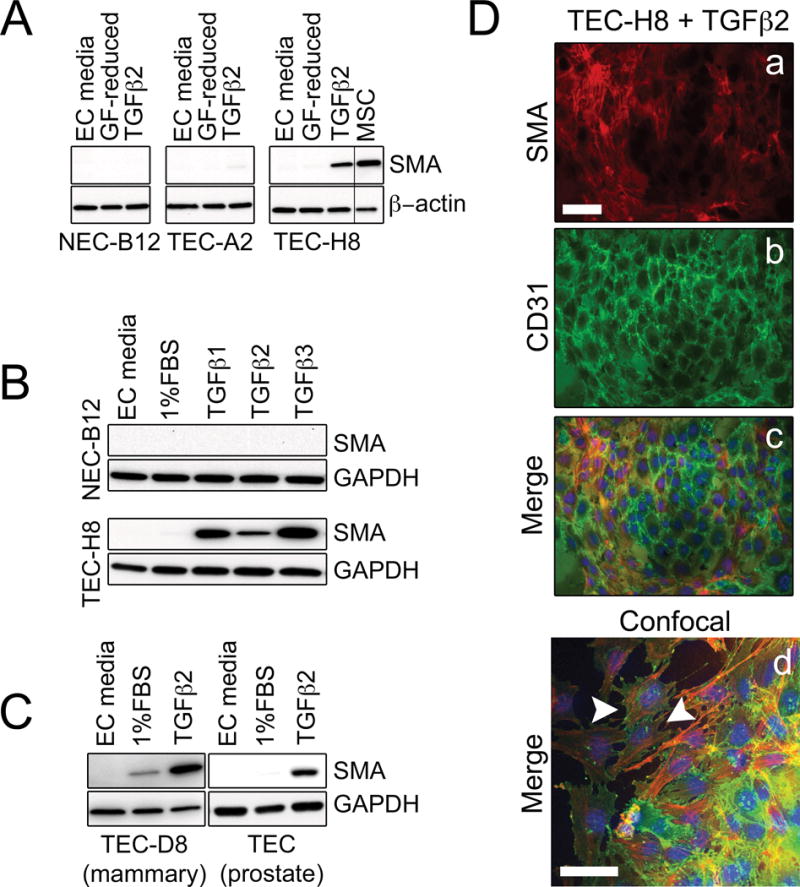
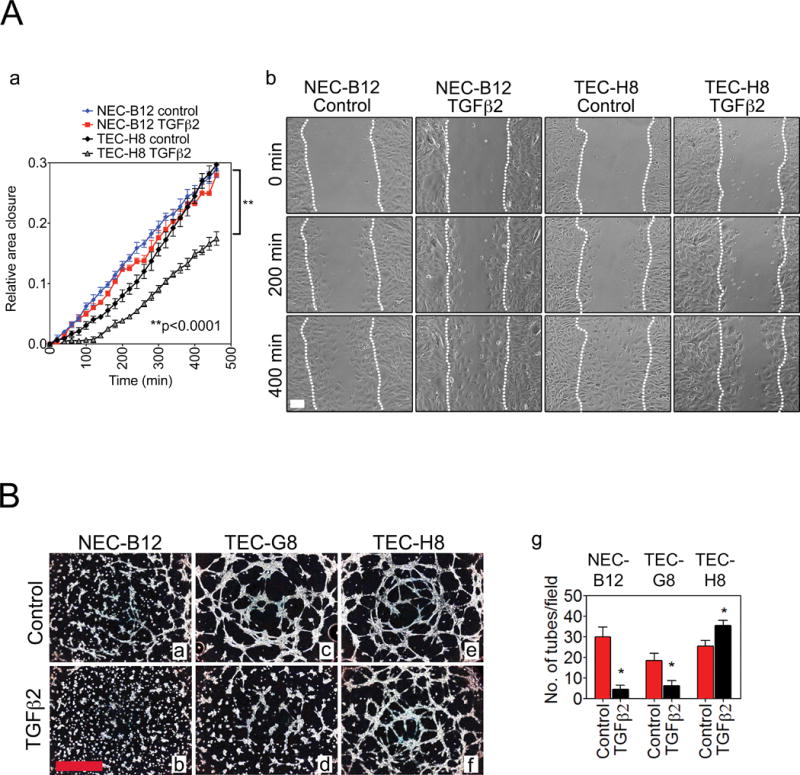
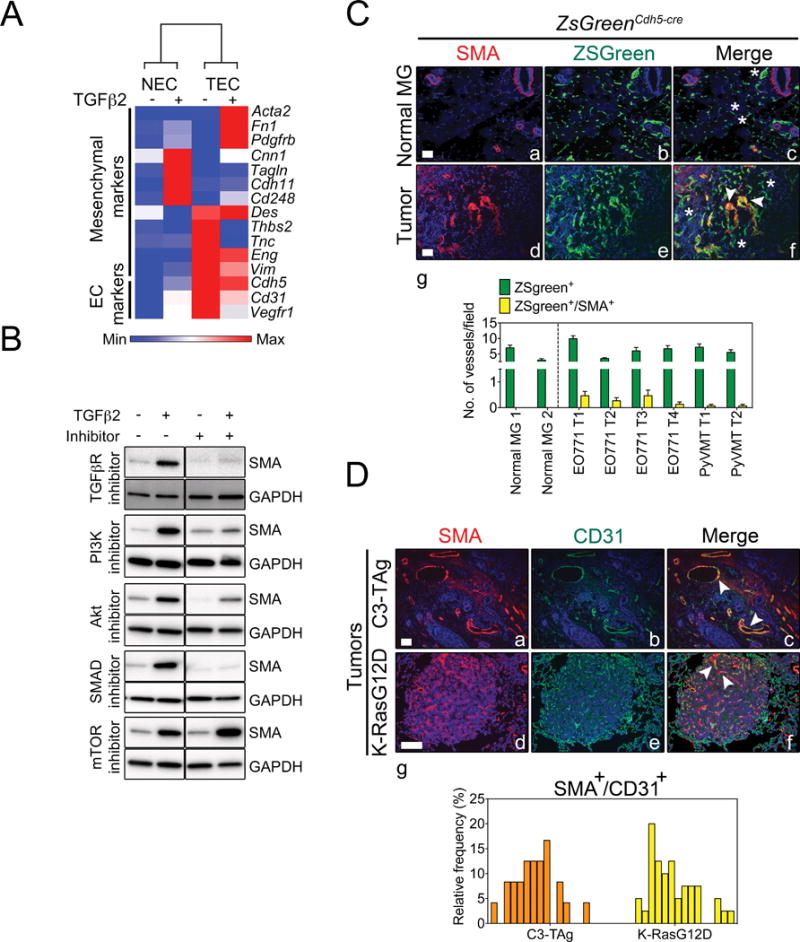
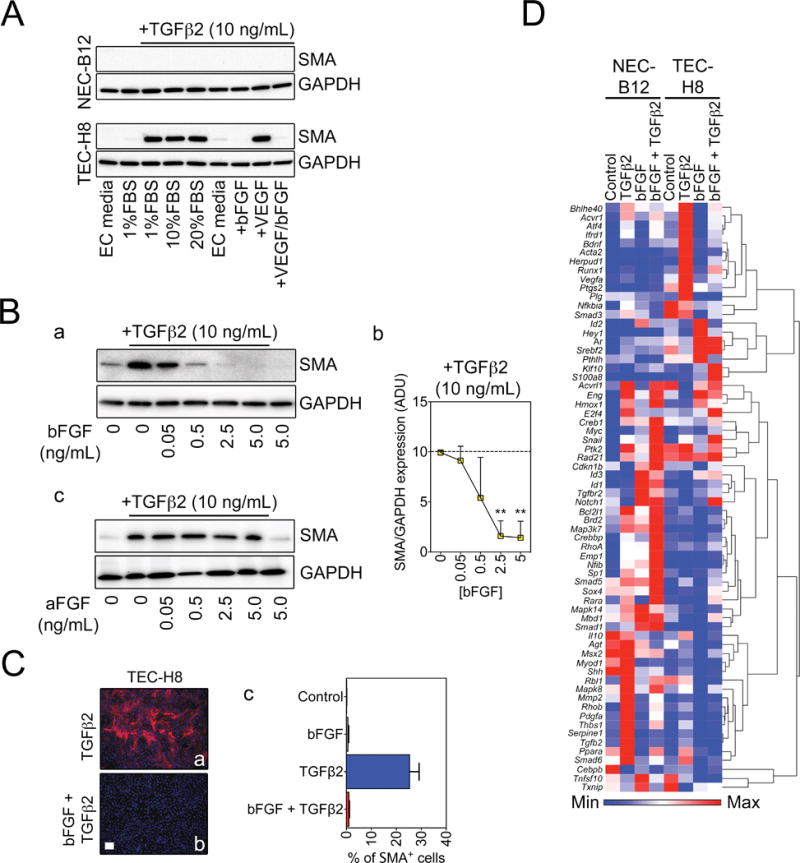
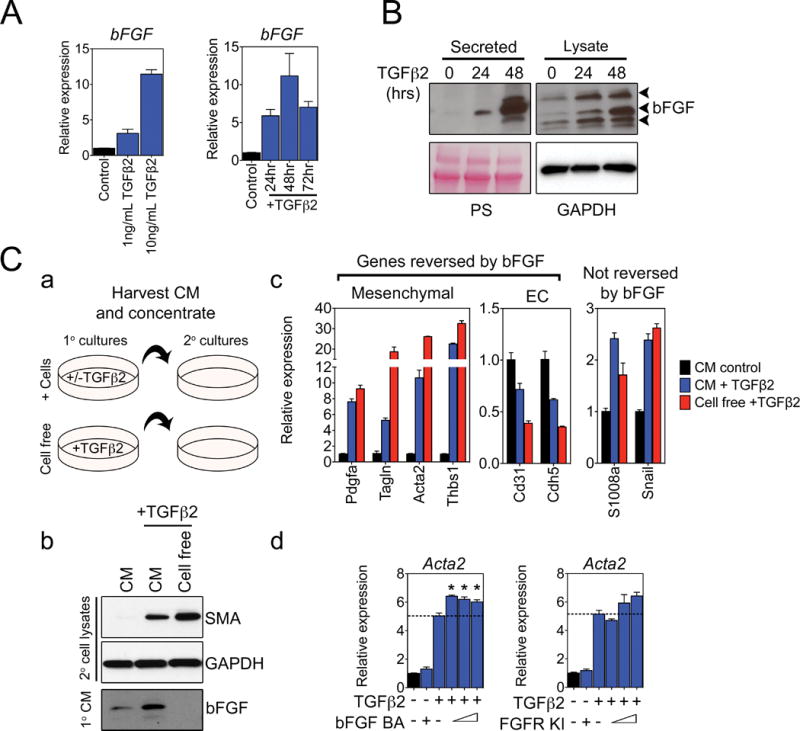
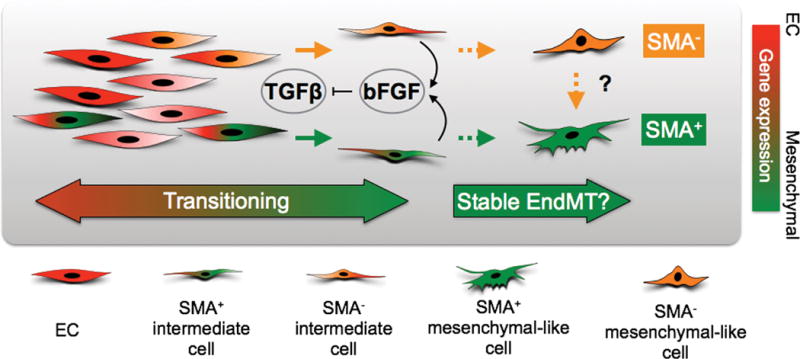
Endothelial-to-mesenchymal transition (EndMT) occurs during development and underlies the pathophysiology of multiple diseases. In tumors, unscheduled EndMT generates cancer-associated myofibroblasts that fuel inflammation and fibrosis, and may contribute to vascular dysfunction that promotes tumor progression. We report that freshly isolated subpopulations of tumor-specific endothelial cells (TEC) from a spontaneous mammary tumor model undergo distinct forms of EndMT in response to TGFβ stimulation. Although some TECs strikingly upregulate α smooth muscle actin (SMA), a principal marker of EndMT and activated myofibroblasts, counterpart normal mammary gland endothelial cells (NEC) showed little change in SMA expression after TGFβ treatment. Compared with NECs, SMA(+) TECs were 40% less motile in wound-healing assays and formed more stable vascular-like networks in vitro when challenged with TGFβ. Lineage tracing using ZsGreen(Cdh5-Cre) reporter mice confirmed that only a fraction of vessels in breast tumors contain SMA(+) TECs, suggesting that not all endothelial cells (EC) respond identically to TGFβ in vivo. Indeed, examination of 84 TGFβ-regulated target genes revealed entirely different genetic signatures in TGFβ-stimulated NEC and TEC cultures. Finally, we found that basic FGF (bFGF) exerts potent inhibitory effects on many TGFβ-regulated genes but operates in tandem with TGFβ to upregulate others. ECs challenged with TGFβ secrete bFGF, which blocks SMA expression in secondary cultures, suggesting a cell-autonomous or lateral-inhibitory mechanism for impeding mesenchymal differentiation. Together, our results suggest that TGFβ-driven EndMT produces a spectrum of EC phenotypes with different functions that could underlie the plasticity and heterogeneity of the tumor vasculature.


Conflict of interest statement

THERE ARE NO CONFLICTS OF INTEREST TO DISCLOSE

Figures

Figure 1
Figure 1. Isolation and characterization of NEC and TEC clones
(A) Schematic diagram of EC isolation procedure. (B) Representative CD31 and CDH5 FACS histogram plots of NEC and TEC clones. Open curves represent cells stained with CD31 or CDH5 antibodies, and solid curves indicate FACS histogram plots of cells stained with an isotype-matched control antibody. (C) Relative mRNA expression by qPCR of Acta2 (SMA), Cd31, and Vegfr-2 in NEC and TEC clones. Gapdh was used as an endogenous control and relative mRNA expression of each gene was expressed as fold increase compared to NEC. MSC were used as a positive control.
Figure 2
Figure 2. Subpopulations of EC undergo a spectrum of EndMT in response to TGFβ2 stimulation
(A) Western blots showing that TGFβ increases SMA protein expression in TEC-H8, a clone that has high basal SMA mRNA levels. Three clones representing NEC (NEC-B12), SMA-low TEC (TEC-A2), and SMA-high TEC (TEC-H8) were treated with 10 ng/mL TGFβ2 in growth factor (GF)-reduced media (20 % FBS LG-DMEM) for 48 hours before being subjected to Western blotting. MSC were used as a positive control. (B) Western blots showing SMA expression in NEC-B12 and TEC-H8 after stimulation with 10 ng/mL TGFβ1, TGFβ2, or TGFβ3 for 48 hours. (C) Western blots showing SMA expression in TEC-D8 and prostate TEC isolated from TRAMP mice after stimulation with 10 ng/mL TGFβ2 for 48 hours. (D) Immunofluorescence images of TEC-H8 stimulated with 10 ng/mL TGFβ2 for 48 hours. Cells were stained with SMA (red, a), CD31 (green, b), and DAPI (blue) as shown in the merged image (c). (d) Merged confocal image of TGFβ2-stimulated TEC-H8. The white arrowheads indicate co-localization of SMA (red) and CD31 (green) in the same cell. Scale bars = 50 μm.
Figure 3
Figure 3
(A) (a) Wound closure rates of NEC-B12 and TEC-H8 treated with or without TGFβ2. (b) Representative images of the wound closure at indicated time points. White dotted lines indicate the migration fronts of cells. Cells were exposed to 10 ng/mL TGFβ2 in 20 % FBS LG-DMEM for ~ 30 minutes before imaging (n = 3). Scale bar = 100 μm. Statistical significance was determined by two-way ANOVA (**P < 0.001). (B) Representative phase-contrast images of Matrigel tube formation of NEC (a, b), TEC-G8 (c, d), and TEC-H8 (e, f) with or without TGFβ2 treatment. (g) Quantification of tubes by counting the number of tubes per field. Scale bar = 1 mm. n = 3–4 observations. Statistical significance was determined using a Student’s t test (*P < 0.05).
Figure 4
Figure 4. Only a fraction of tumor vessels contain SMA+ TEC
(A) Heat-map representation of mesenchymal and endothelial marker mRNA levels by qPCR in NEC-B12 and TEC-H8 clones treated with or without of TGFβ2. Gapdh was used as an endogenous control. The heat map was generated using Gene-E software. (B) Western blots demonstrating that TGFβ2 up-regulates SMA expression in TEC-H8 via SMAD2/3 and PI3K pathways. TGFβ2R inhibitor (SB431542): 10 μM, PI3K inhibitor (LY294002): 3 μM, Akt inhibitor VIII: 5 μM, SMAD 3 inhibitor (SIS3): 3 μM, and mTOR inhibitor (rapamycin): 100 nM. (C) Representative immunofluorescent images of normal mammary glands (Normal MG) (a–c) and mammary tumors (d–f) from lineage-traced ZsGreenCdh5-cre mice showing SMA staining (red), blood vessels that are tagged with ZsGreen (green), and nuclear staining with DAPI (blue). Mammary tumors were induced by orthotopic injection of E0771 or PyVMT tumor cells in ZsGreenCdh5-cre mice. The arrowheads indicate ZsGreen+/SMA+ vessels and asterisks indicate ZsGreen+/SMA vessels. (g) Quantification of vessels containing ZsGreen+/SMA+ cells in normal mammary glands and mammary tumors. (D) Representative immunofluorescent staining of SMA (red), CD31 (green), and DAPI (blue) in spontaneous C3-TAg mammary tumors (a–c) and K-RasG12D lung tumors (d–f). The arrowheads indicate ZsGreen+/SMA+ vessels. Scale bars = 100 μm. (g) Frequency distribution of vessels containing CD31+/SMA+ cells in C3-TAg and K-RasG12D tumors. Each bar represents one microscopic field of view.
Figure 5
Figure 5. bFGF opposes the expression of some TGFβ target genes but augments the expression of others
(A) Western blots showing that bFGF but not VEGF blocks SMA protein expression in TEC-H8. (B) (a) Representative Western blots demonstrating that bFGF suppresses TGFβ2-induced SMA expression in a dose-dependent manner. (b) Densitometry quantification of SMA expression (n = 3). Statistical significance was determined using One-way ANOVA with Bonferroni post test (**P < 0.01). ADU: arbitrary density units. (c) Western blots showing that aFGF does not suppress TGFβ2-induced SMA expression. (C) Representative immunofluorescent images of SMA expression in TEC-H8 stimulated with TGFβ2 in the absence (a) or presence (b) of bFGF. (c) Quantification of SMA+ cells from immunofluorescence. Scale bar = 100 μm. (D) Heat map and hierarchical clustering of gene expression of NEC and TEC-H8 clones analyzed using the Mouse TGFβ Signaling Targets RT2 Profiler™ PCR Array. Cells were stimulated for 48 hours with TGFβ2 and/or bFGF as indicated, and the arrays were performed in duplicate. Results were normalized and log-transformed, and genes were clustered using Pearson’s correlation.
Figure 6
Figure 6. EC challenged with TGFβ secrete their own bFGF which suppresses mesenchymal-like differentiation in secondary cultures
(A) Dose- and time-dependent induction of bFGF mRNA expression in TEC-H8 challenged with TGFβ2. In the dose-response experiment, cells were treated with increasing concentrations of TGFβ2 for 48 hours, and in the time-dependent experiment, cells were stimulated with 10 ng/mL TGFβ2. (B) Western blots showing secreted and intracellular bFGF in TEC-H8 challenged with 10 ng/mL TGFβ2 for the indicated times. Ponceau staining (PS) and GAPDH were used as loading controls for secreted proteins and cell lysates, respectively. The arrowheads indicate bFGF isoforms of different molecular weights. (C) Secondary TEC-H8 culture treatments with conditioned media (CM) obtained from TEC-H8 challenged with TGFβ2. (a) Schematic diagram of the CM experiment. Media conditioned by TEC-H8 stimulated with or without TGFβ2, and media containing only TGFβ2 were concentrated and used to treat secondary TEC-H8 cultures for 48 hours. (b) Western blot of SMA expression in the secondary TEC cultures treated with CM or cell-free media, and Western analysis of secreted bFGF in the CM and cell-free media. (c) qPCR analysis of changes in mRNA expression in secondary TEC-H8 cultures treated with CM or cell-free media. (d) qPCR analysis of Acta2 (SMA) mRNA expression in TEC-H8 treated with increasing doses of either a bFGF blocking antibody (BA) or a FGFR kinase inhibitor (KI) in the presence of 10 ng/mL TGFβ2 for 48 hours. From left to right: the bFGF BA concentrations are 0 μg/mL, 20 μg/mL, 0 μg/mL, 10 μg/mL, 15 μg/mL, and 20 μg/mL, and the FGFR KI concentrations are 0 nM, 200 nM, 0 nM, 40 nM, 120 nM, and 200 nM. Graphs are representative of three independent experiments. Error bars represent SEM (n = 3). Significance was determined using a one-way ANOVA and is indicated by an asterisk (P < 0.05).
Figure 7
Figure 7. Schematic diagram of TGFβ and bFGF interactions during EndMT
Heterogeneous EC populations consist of cells with a spectrum of basal SMA mRNA expression suggesting that some EC possess intrinsic ability to gain SMA protein expression. Transient TGFβ exposure stimulates EC to undergo reversible EndMT where some EC transition into SMA+ intermediate cells whereas others form SMA intermediate cells. EC also up-regulate bFGF in response to TGFβ, providing a mechanism to counteract TGFβ, thereby maintaining endothelial specification via an autocrine or paracrine loop. Prolonged TGFβ stimulation may force EC to reach a “point of no return” and enter an irreversible or stable EndMT state. EC at this stage may completely lose endothelial specification, which cannot be rescued by bFGF addition or TGFβ removal, and generate either SMA+ or SMA mesenchymal-like cells. It is also possible there are epigenetic barriers are in place among heterogeneous EC that restricts SMA mesenchymal-like EC from becoming SMA+, but these barriers could be overcome depending on specific conditions in the tumor microenvironment.

Similar articles

Cited by

References

    1. Bischoff J, Aikawa E. Progenitor Cells Confer Plasticity to Cardiac Valve Endothelium. J of Cardiovasc Trans Res. 2011 - PubMed
    1. Cooley BC, Nevado J, Mellad J, Yang D, St Hilaire C, Negro A, et al. TGF-β signaling mediates endothelial-to-mesenchymal transition (EndMT) during vein graft remodeling. Sci Transl Med. 2014;6:227ra34–4. - PMC - PubMed
    1. Maddaluno L, Rudini N, Cuttano R, Bravi L, Giampietro C, Corada M, et al. EndMT contributes to the onset and progression of cerebral cavernous malformations. Nature. 2013;498:492–6. - PubMed
    1. Zeisberg EM, Tarnavski O, Zeisberg M, Dorfman AL, McMullen JR, Gustafsson E, et al. Endothelial-to-mesenchymal transition contributes to cardiac fibrosis. Nat Med. 2007;13:952–61. - PubMed
    1. Zeisberg EM, Potenta S, Xie L, Zeisberg M, Kalluri R. Discovery of endothelial to mesenchymal transition as a source for carcinoma-associated fibroblasts. Cancer Res. 2007;67:10123–8. - PubMed

Publication types

Substances