Randomized Controlled Trial
. 2015 Apr:58:48-58.
doi: 10.1016/j.jaut.2015.01.001. Epub 2015 Jan 26.

Low-dose interleukin-2 fosters a dose-dependent regulatory T cell tuned milieu in T1D patients

Affiliations
Randomized Controlled Trial

Low-dose interleukin-2 fosters a dose-dependent regulatory T cell tuned milieu in T1D patients

Michelle Rosenzwajg et al. J Autoimmun. 2015 Apr.

Abstract

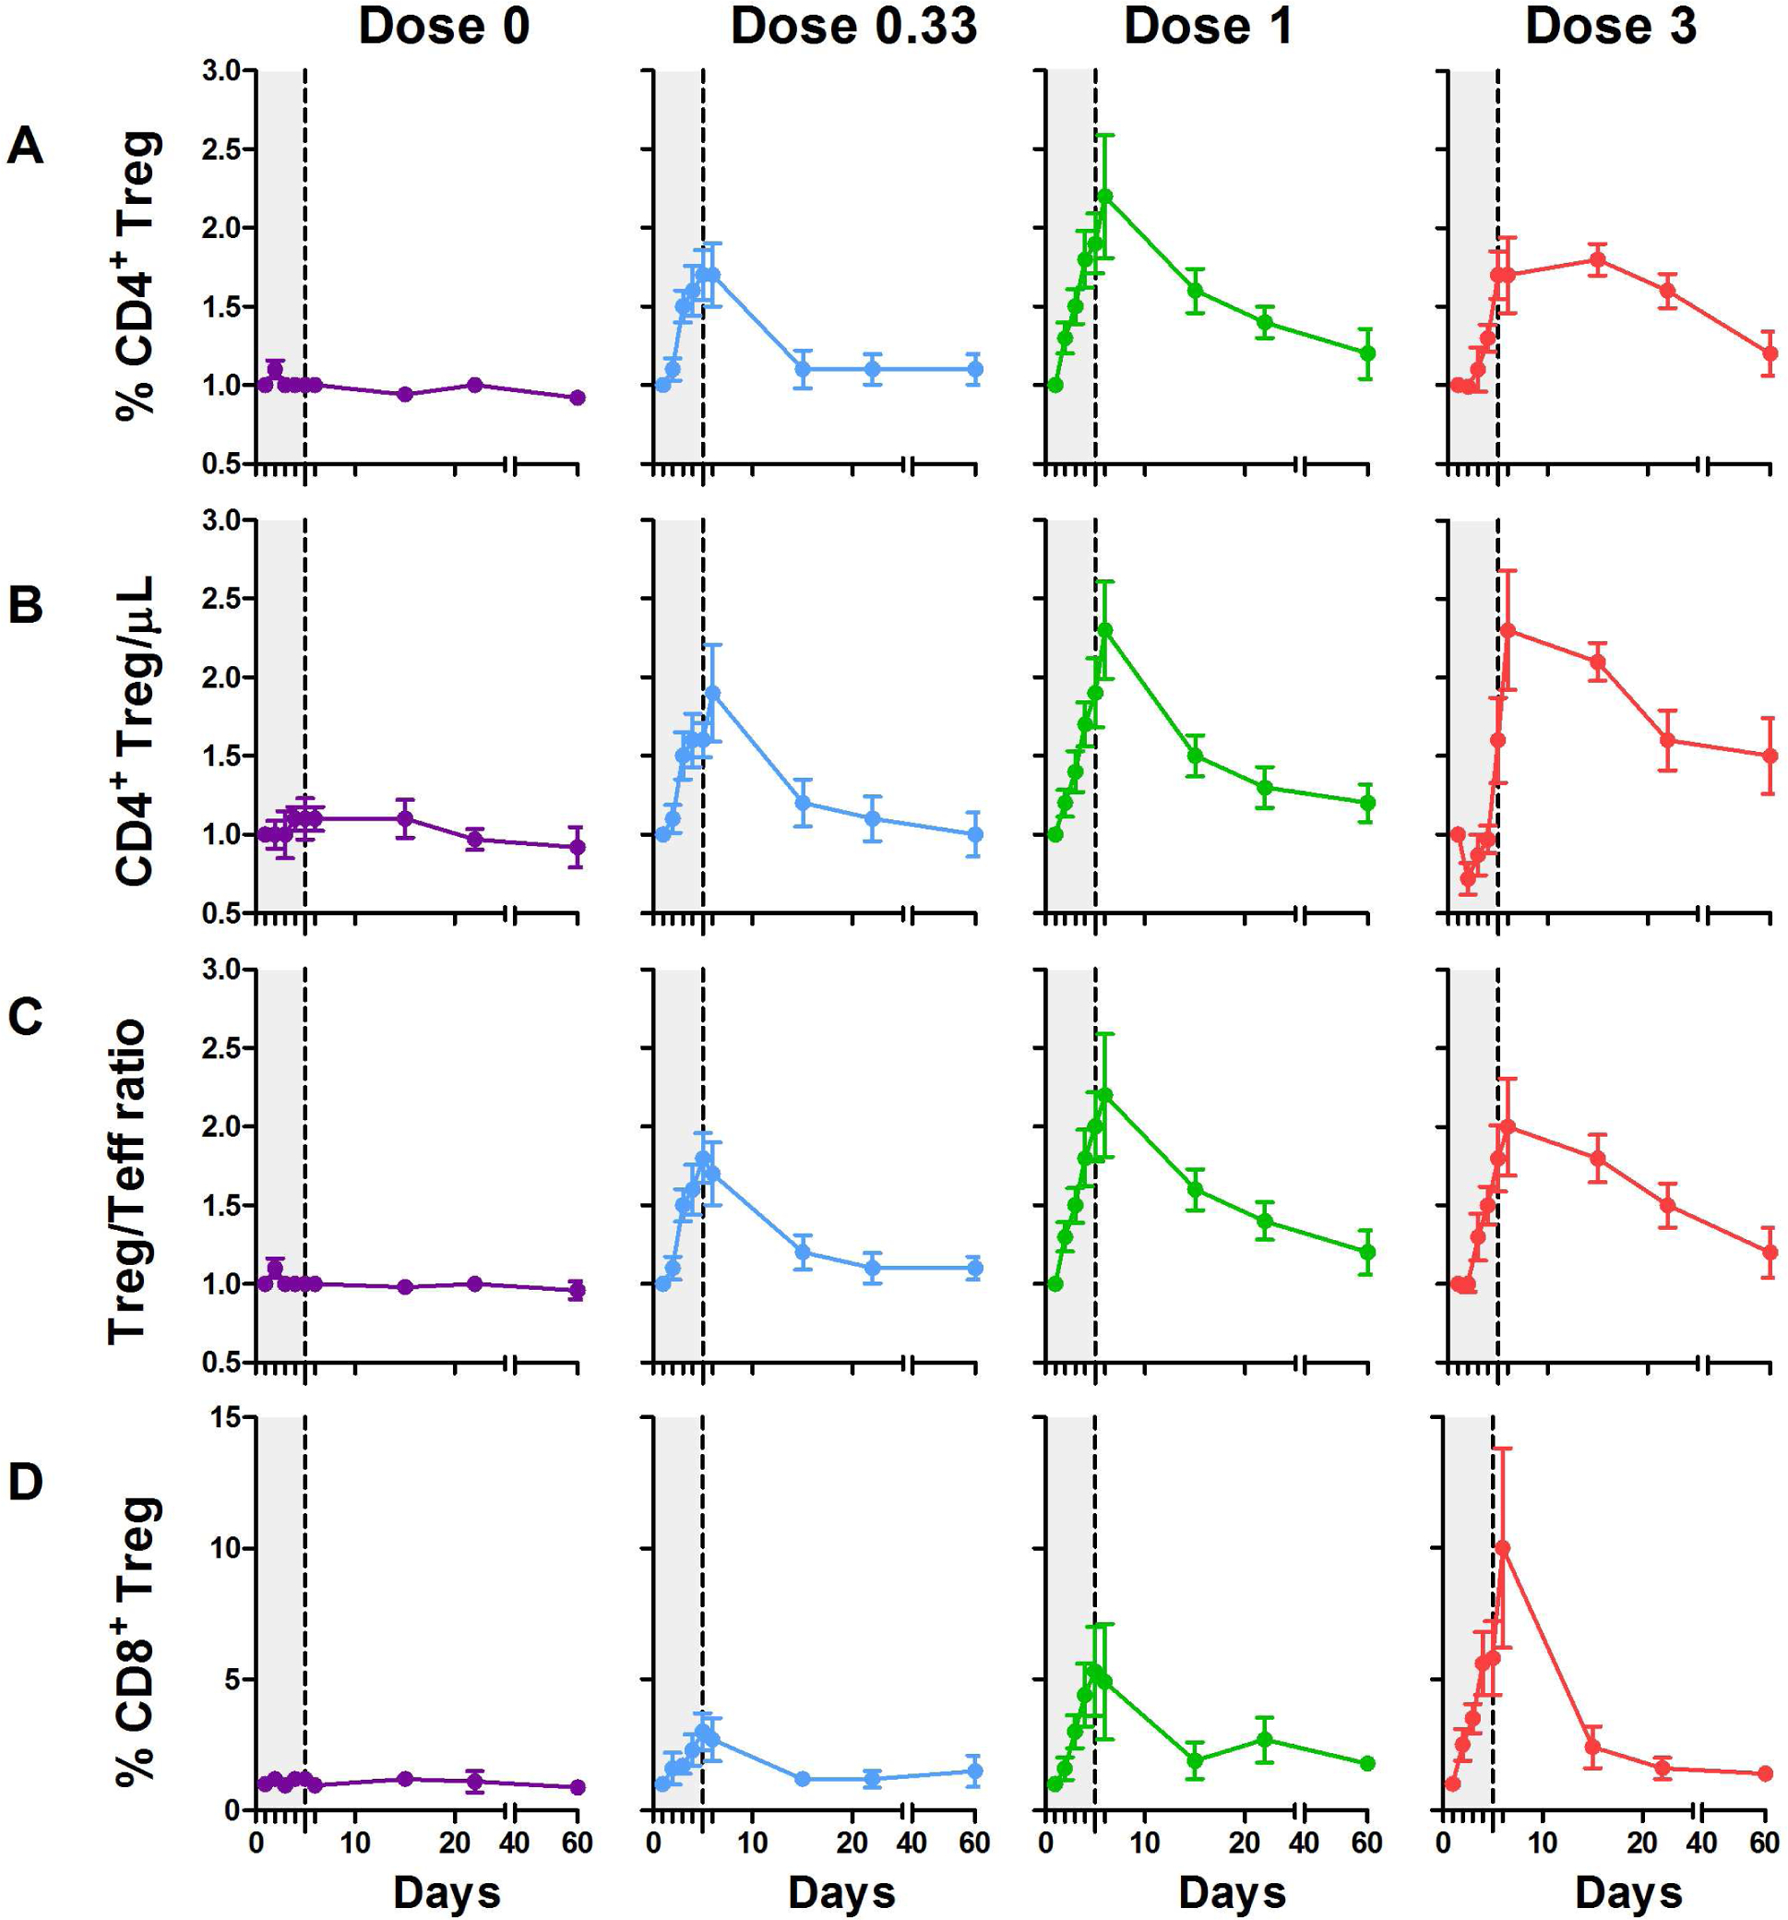
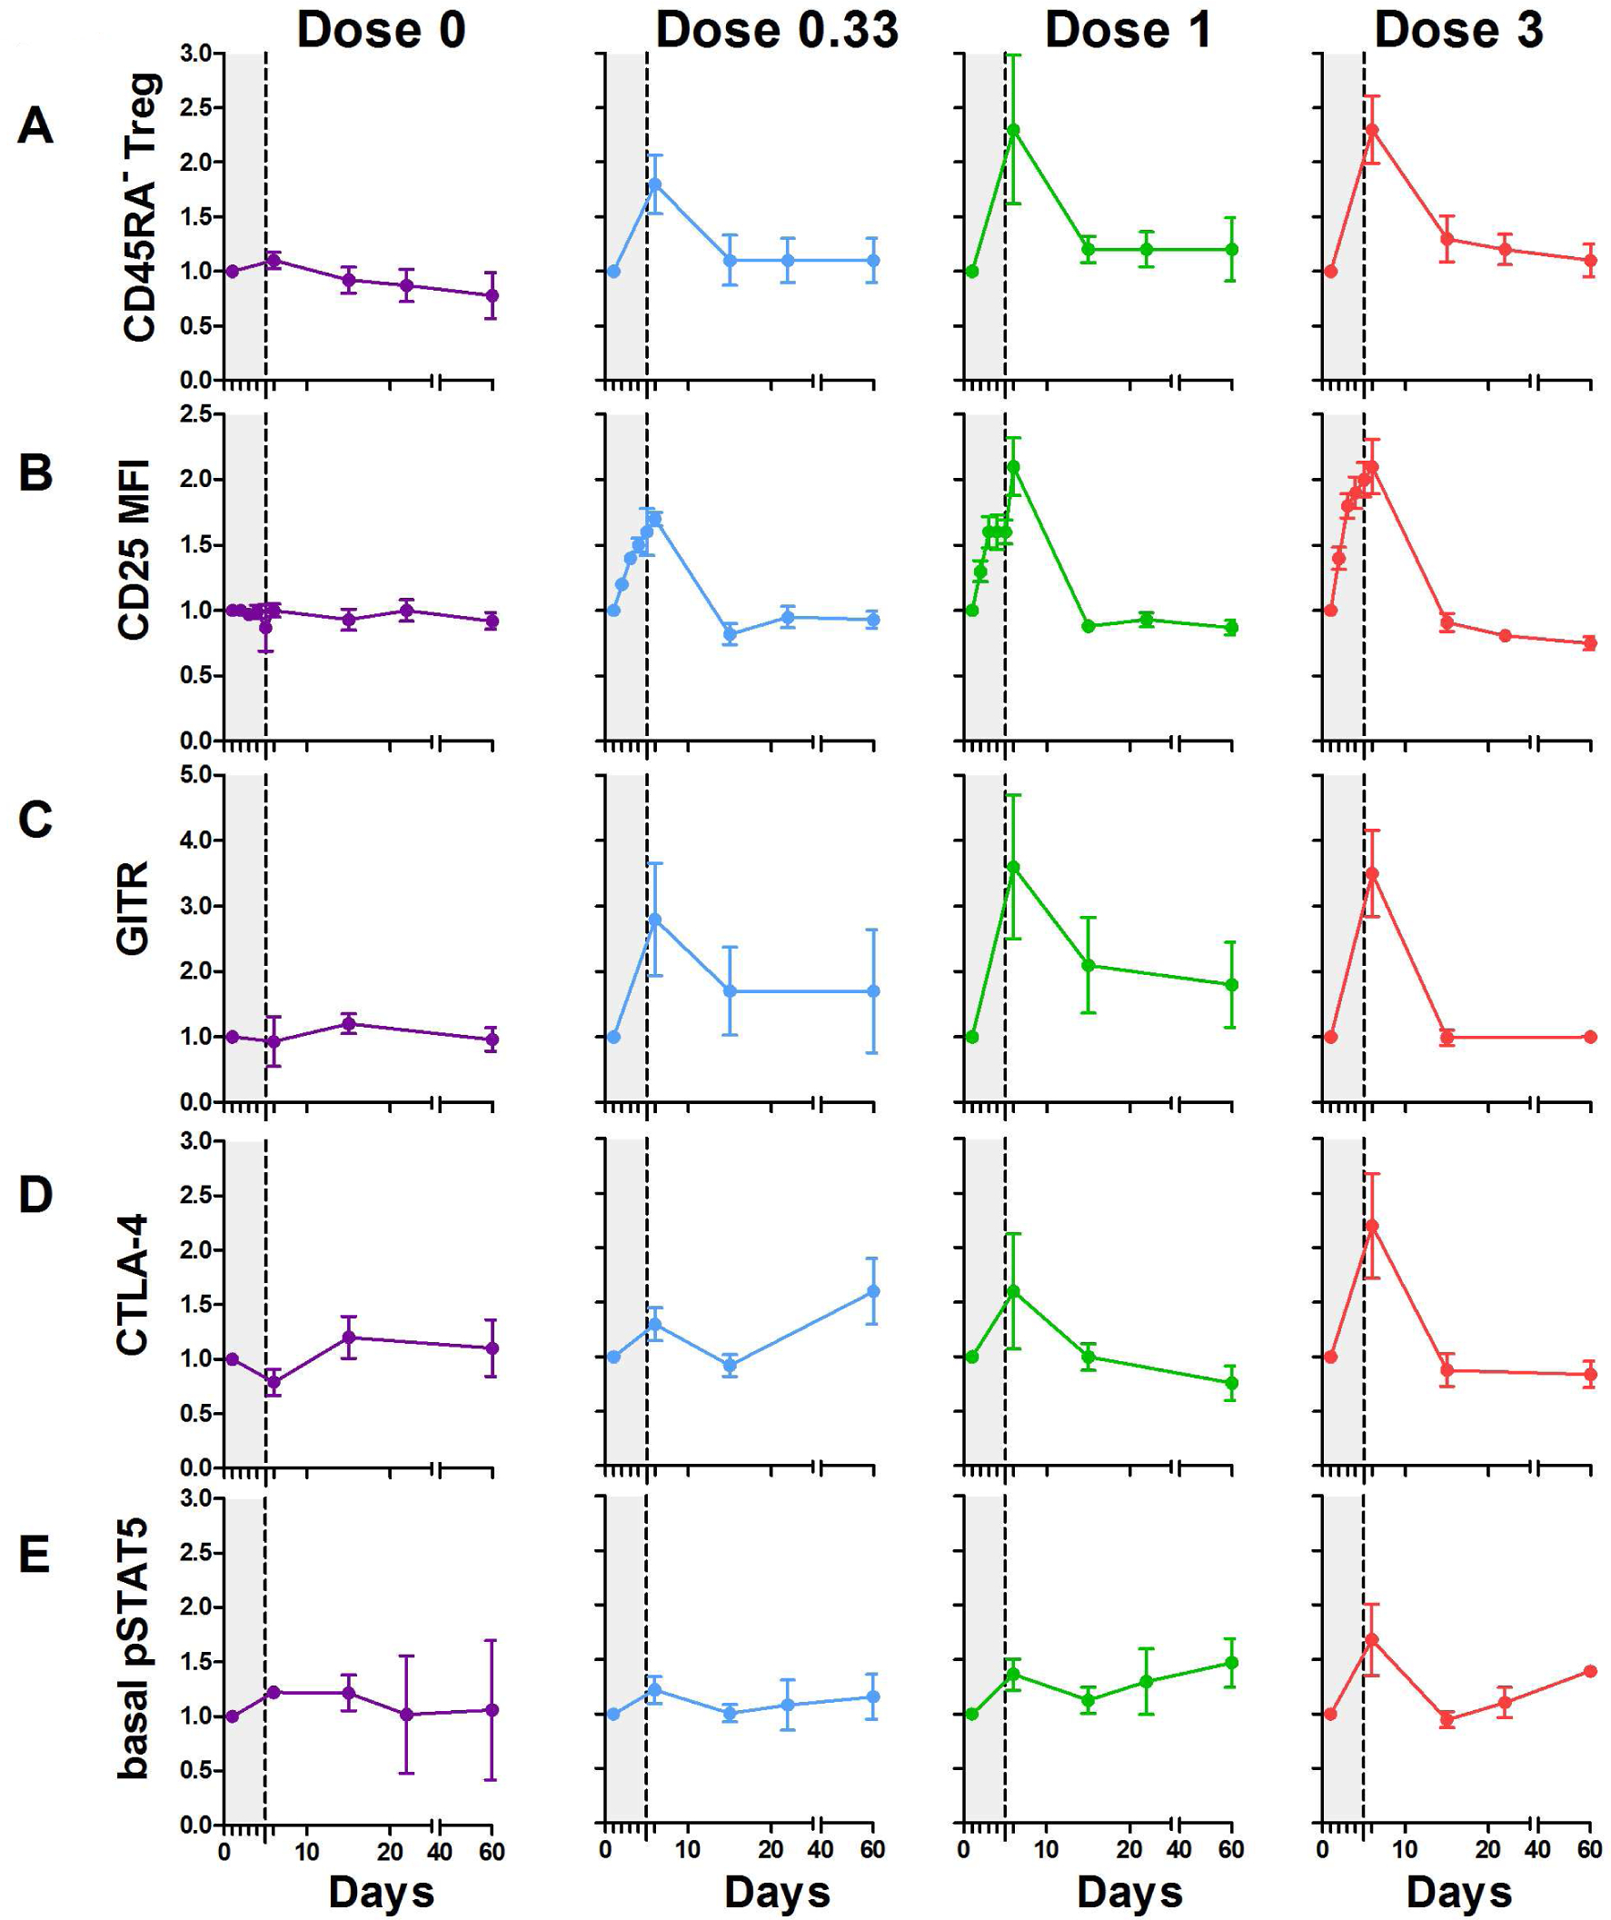
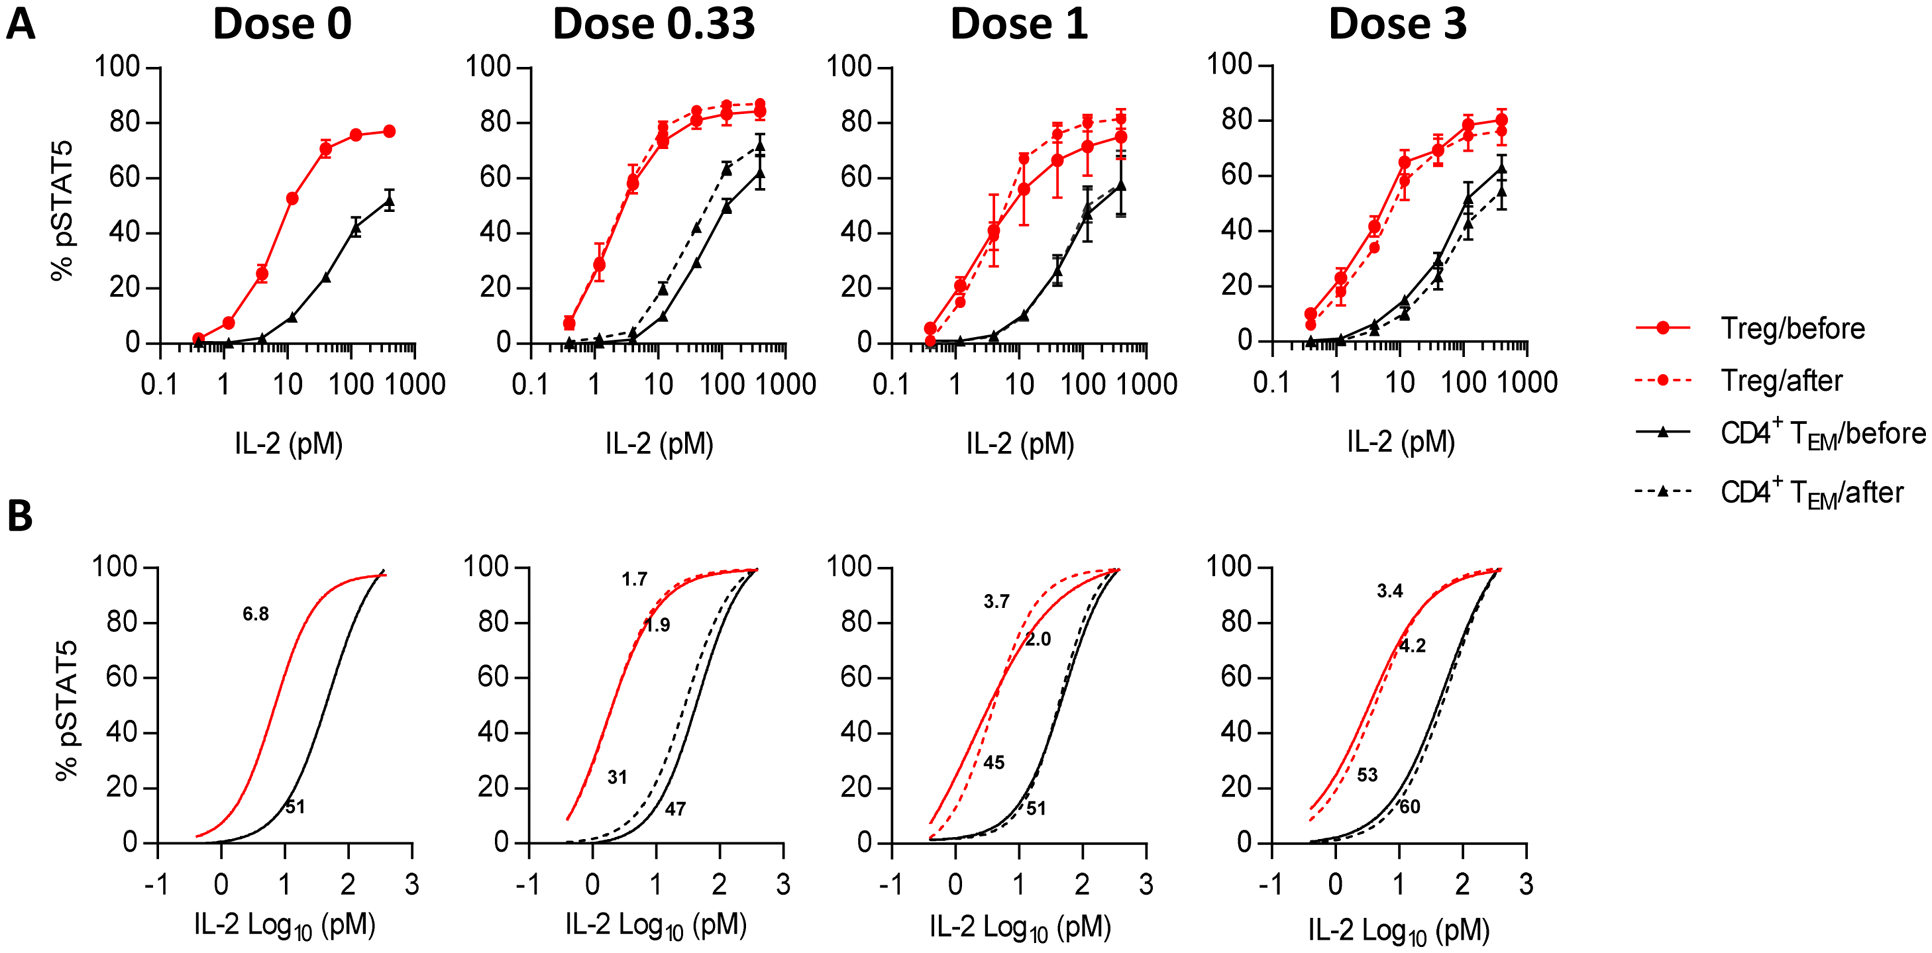
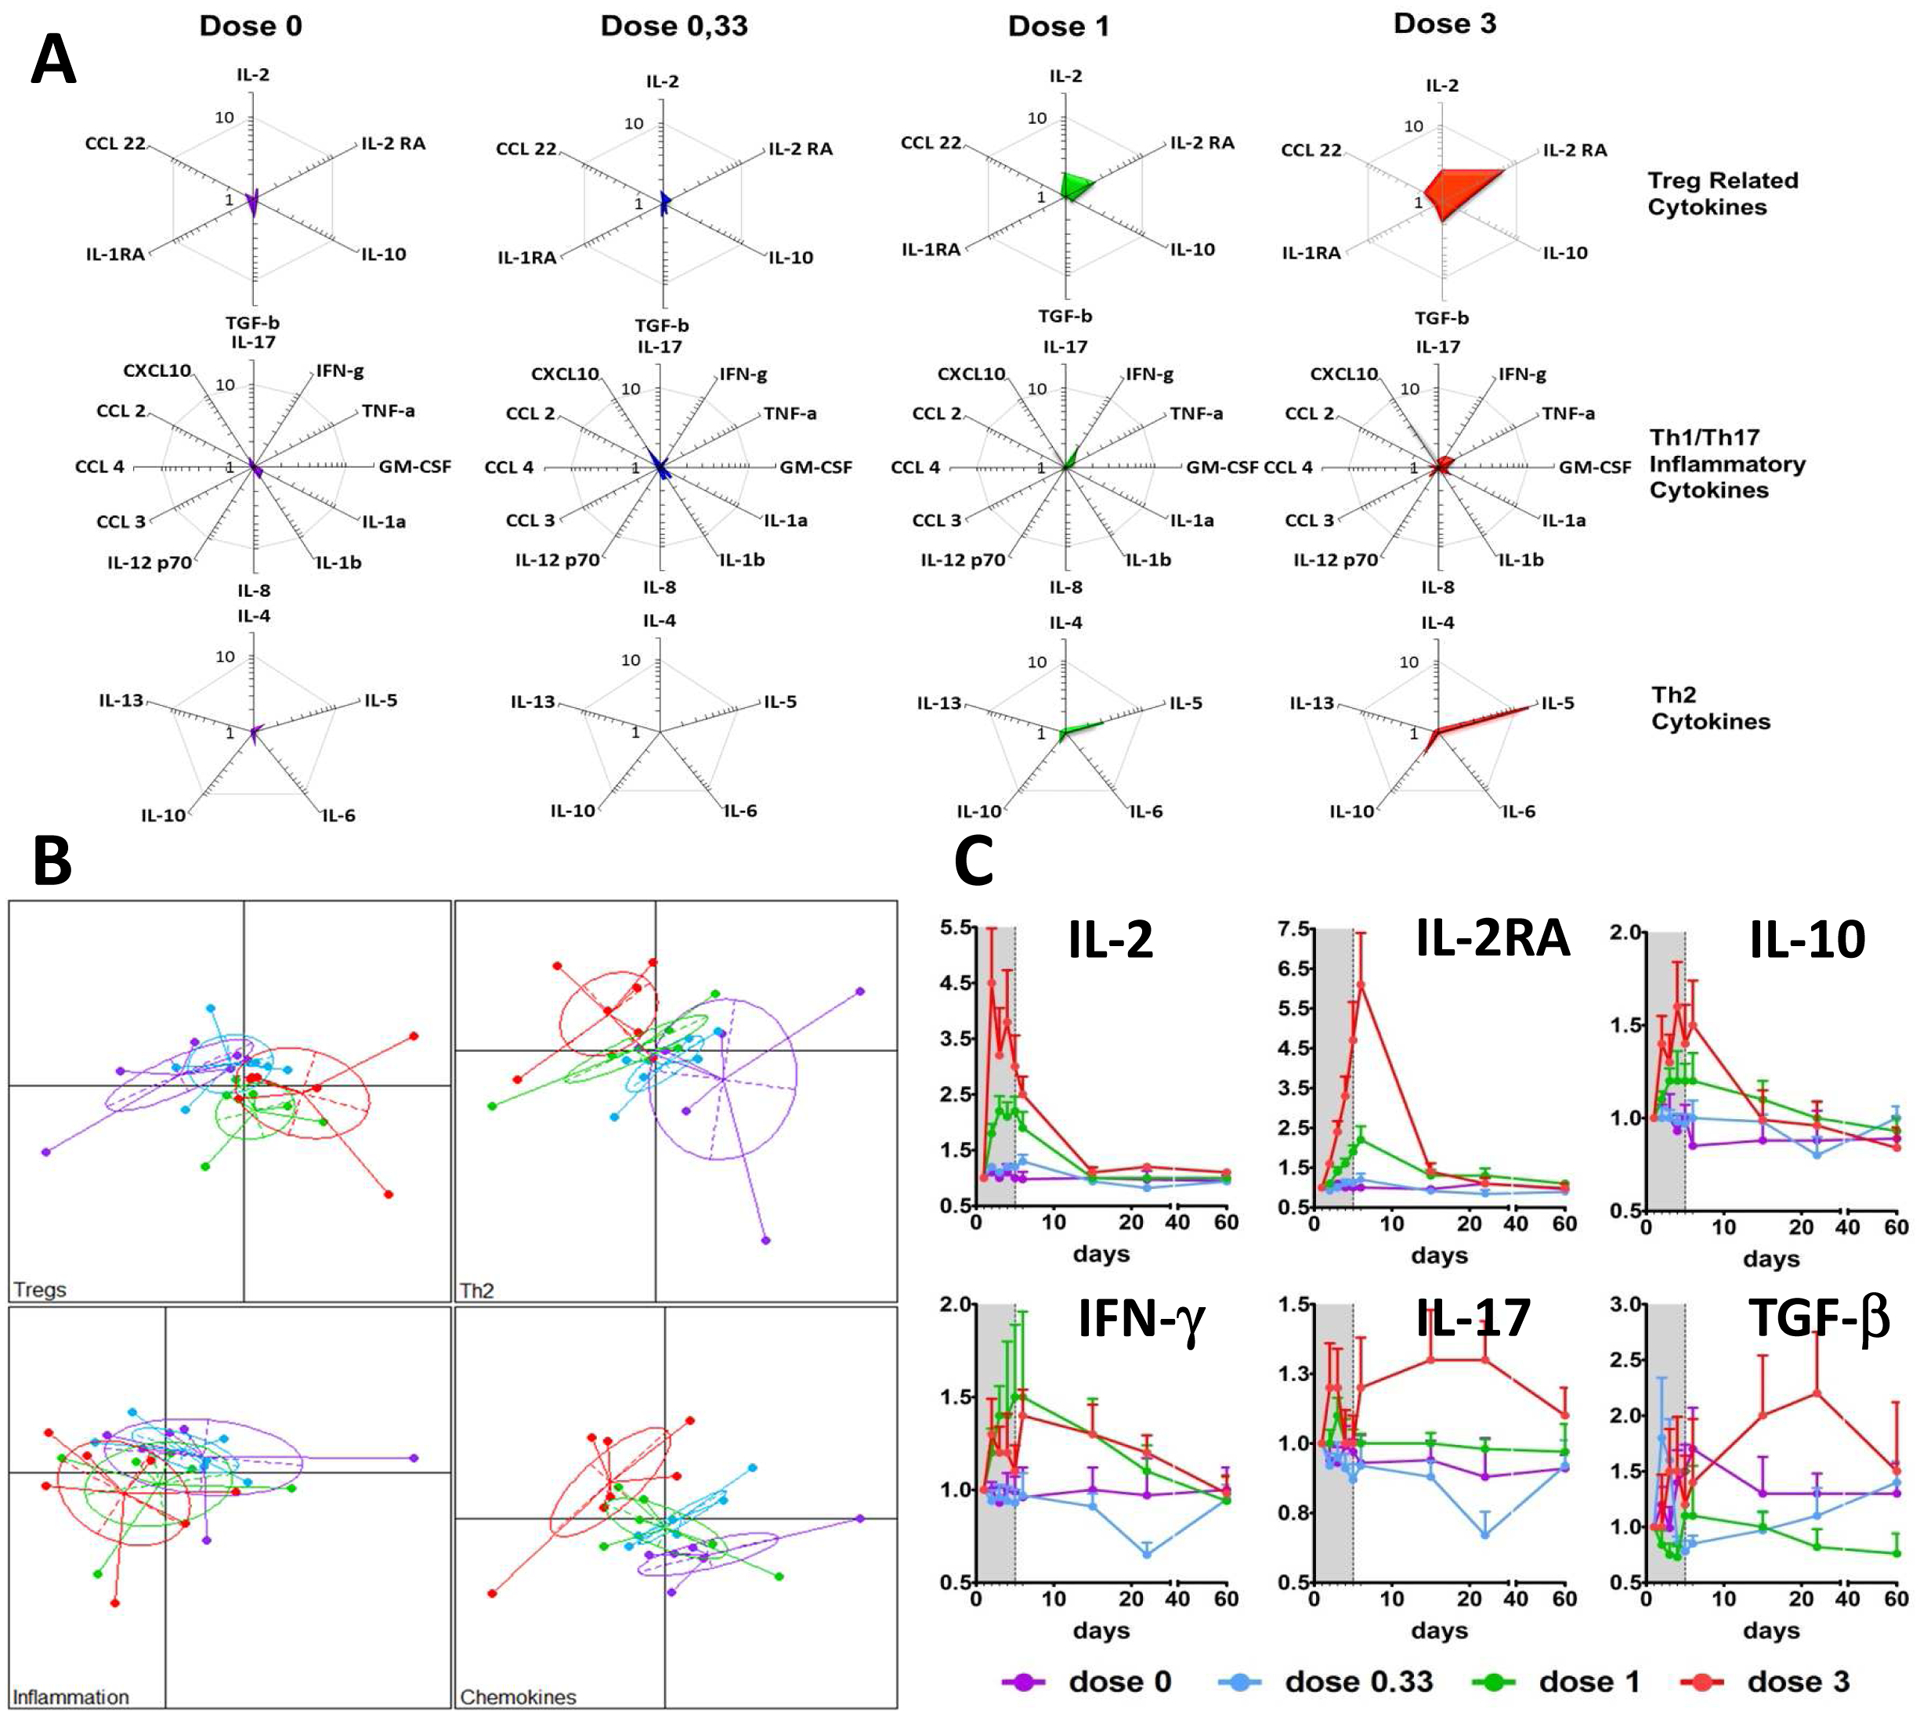
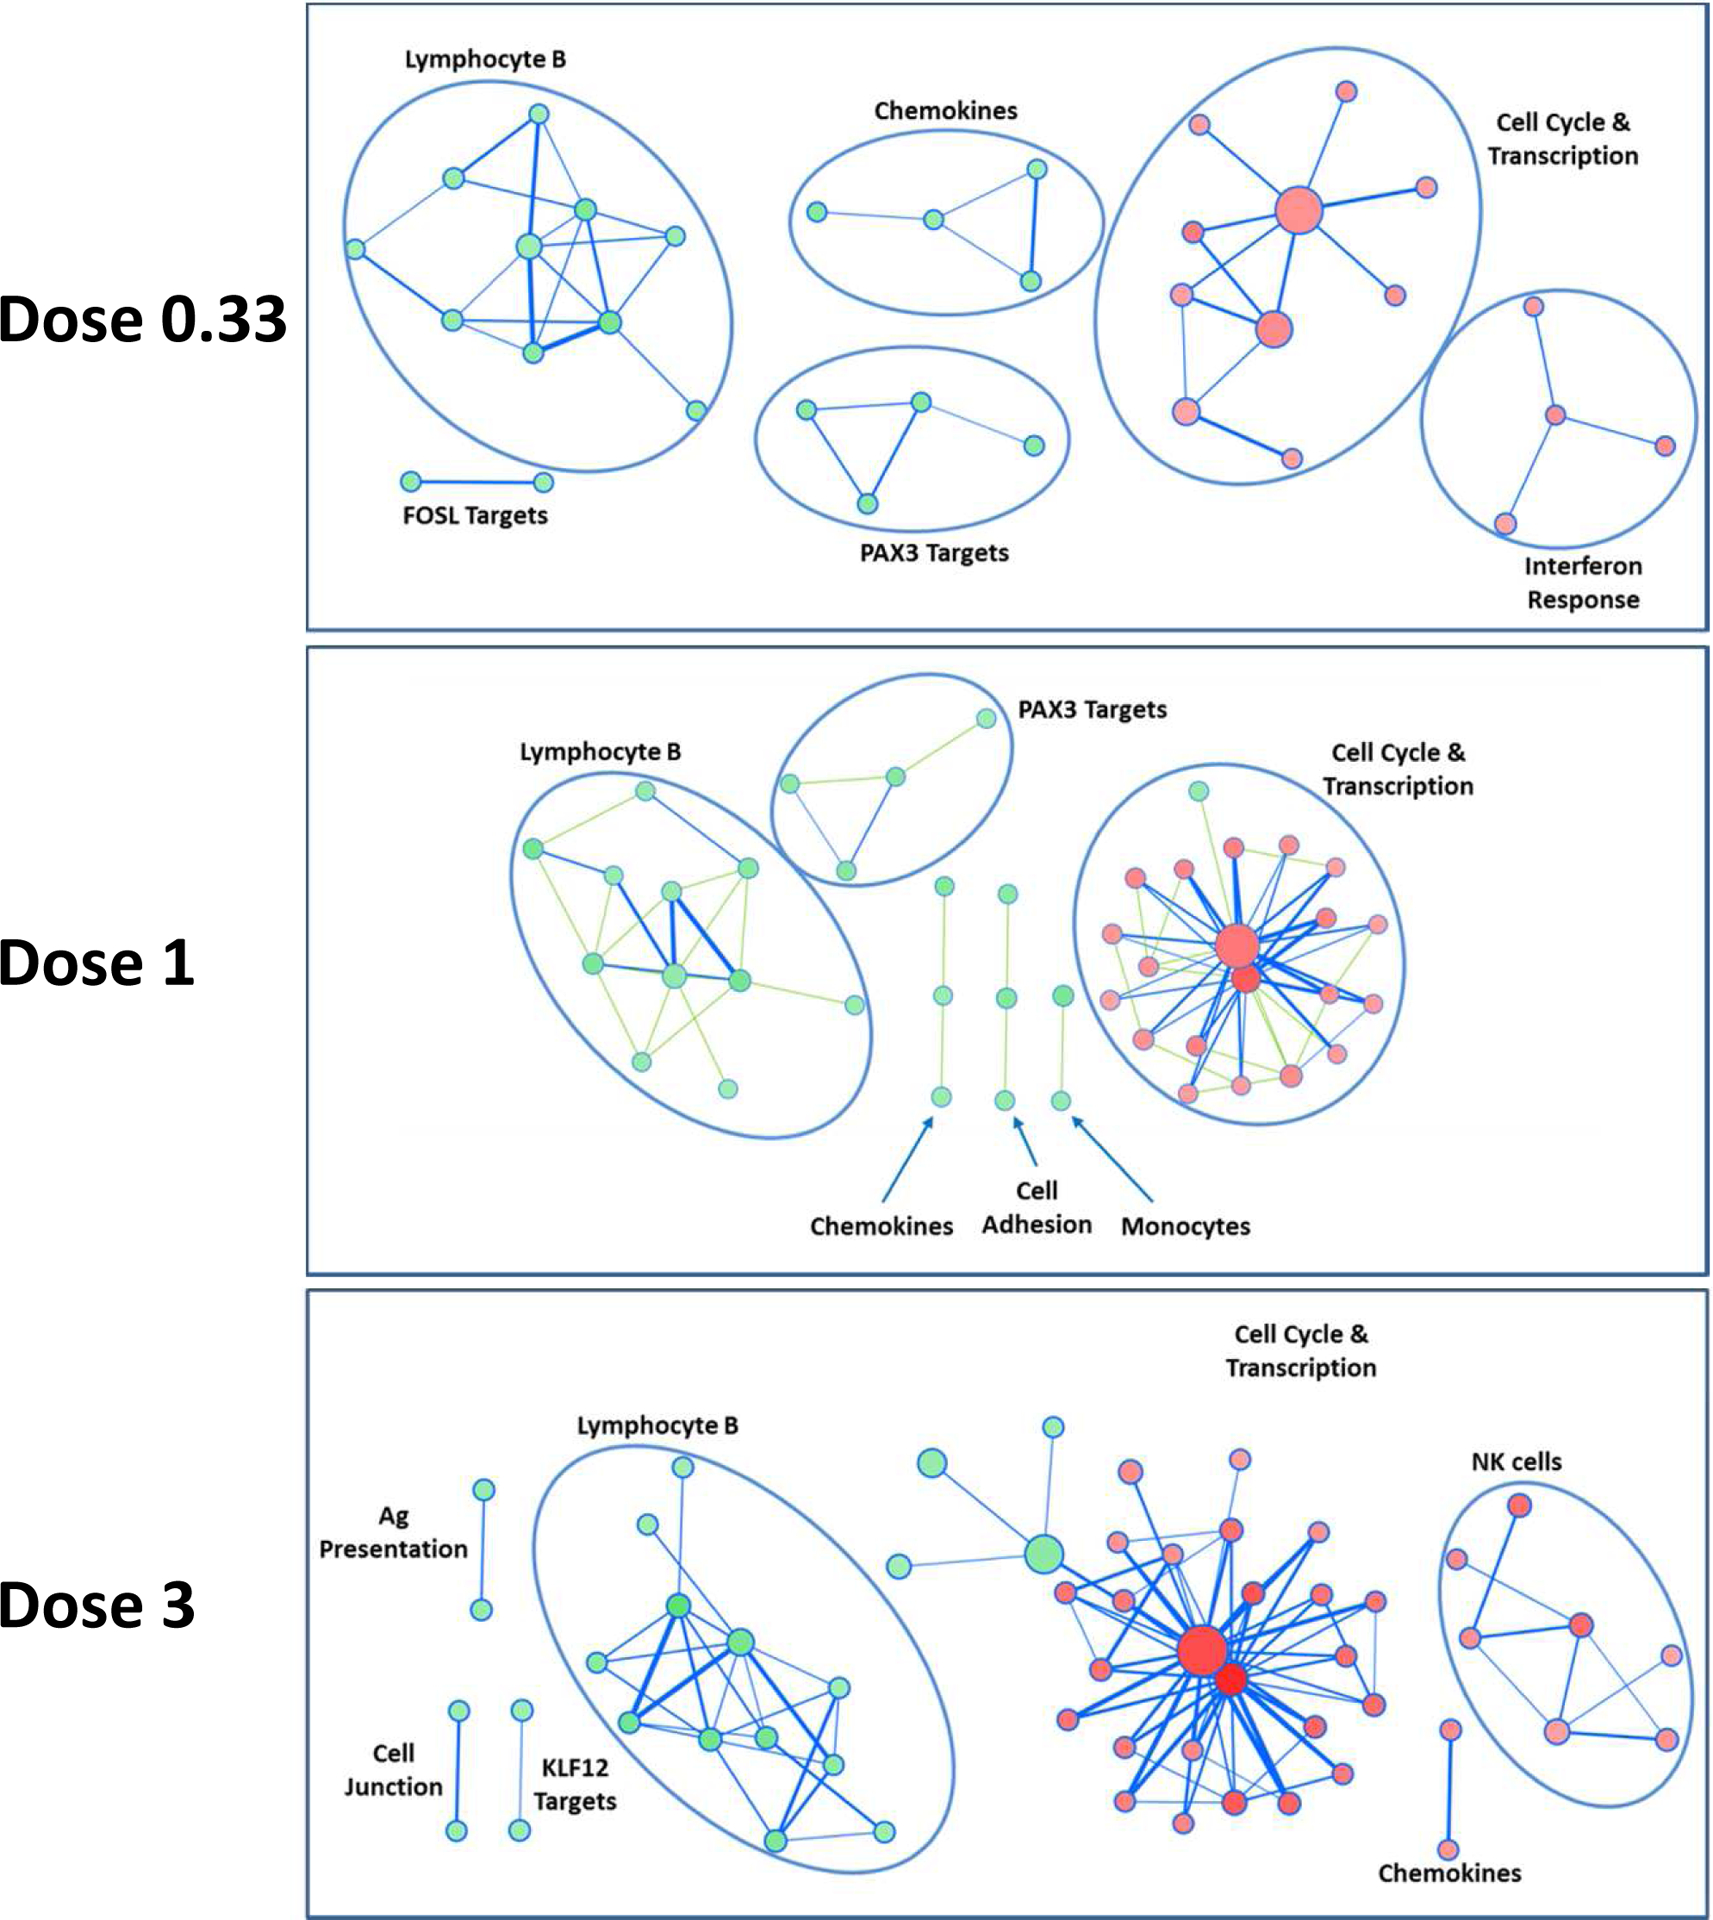
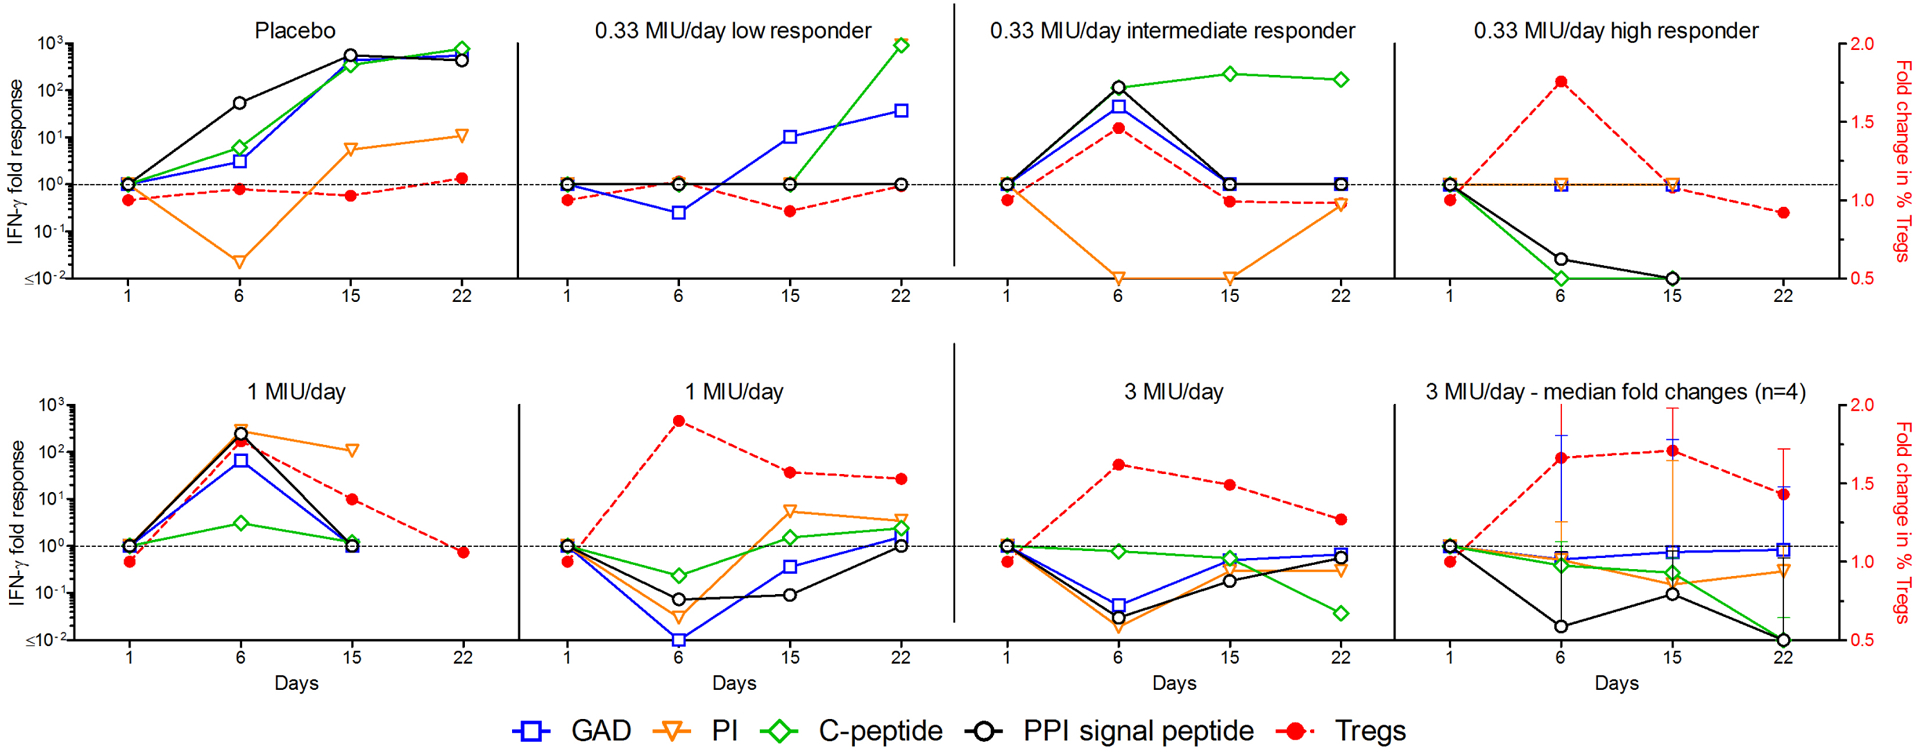
Most autoimmune diseases (AID) are linked to an imbalance between autoreactive effector T cells (Teffs) and regulatory T cells (Tregs). While blocking Teffs with immunosuppression has long been the only therapeutic option, activating/expanding Tregs may achieve the same objective without the toxicity of immunosuppression. We showed that low-dose interleukin-2 (ld-IL-2) safely expands/activates Tregs in patients with AID, such HCV-induced vasculitis and Type 1 Diabetes (T1D). Here we analyzed the kinetics and dose-relationship of IL-2 effects on immune responses in T1D patients. Ld-IL-2 therapy induced a dose-dependent increase in CD4(+)Foxp3(+) and CD8(+)Foxp3(+) Treg numbers and proportions, the duration of which was markedly dose-dependent. Tregs expressed enhanced levels of activation markers, including CD25, GITR, CTLA-4 and basal pSTAT5, and retained a 20-fold higher sensitivity to IL-2 than Teff and NK cells. Plasma levels of regulatory cytokines were increased in a dose-dependent manner, while cytokines linked to Teff and Th17 inflammatory cells were mostly unchanged. Global transcriptome analyses showed a dose-dependent decrease in immune response signatures. At the highest dose, Teff responses against beta-cell antigens were suppressed in all 4 patients tested. These results inform of broader changes induced by ld-IL-2 beyond direct effects on Tregs, and relevant for further development of ld-IL-2 for therapy and prevention of T1D, and other autoimmune and inflammatory diseases.

Keywords: Immunopathology; Immunotherapy; Inflammation; Pharmacokinetics; Tolerance.


Figures

Fig 1:
Fig 1:. Dose-dependent increase of Treg in T1D patients treated by ld-IL-2
Each curve represents changes in CD25highCD127Foxp3+ among CD4+ T cells (percentages in A and absolute numbers in B), in Treg/Teff ratio (C) and in percentages of CD8+CD25+Foxp3+ cells (D). Data are shown as mean ± SEM of individual results normalized by baseline values for each patient at different time points (the grey zone represents the 5 days IL-2 treatment).
Fig 2:
Fig 2:. Dose-dependent Treg activation in T1D patients treated by ld-IL-2
Curves represent changes in Treg activation markers. Percentage of CD25highCD127 CD45RA Tregs among CD4+ cells (A). CD25 MFI (B), percentage of GITR+ (C), CTLA-4+ (D) and basal pSTAT5 expression (E) in CD4+CD25highCD127Foxp3+Tregs. Data are shown as mean ± SEM of patients’ values normalized by individual baseline values at different time points (the grey zone represents the 5 days IL-2 treatment). Results are for all 6 patients per group, except for pSTAT5 measurement for which 2, 3, 3 and 3 patients were studied for the 0, .33, 1 and 3 MIU doses, respectively.
Fig 3:
Fig 3:. Selective IL-2-dependent activation of STAT5 by Tregs does not vary after ld-IL- 2 therapy
PBMC from controls (n=4) or patients treated with 0.33 MIU (n=3), 1 MIU (n=2), and 3 MIU (n=3) of IL-2 were stimulated with IL-2 for 15 minutes and the activation of pSTAT5 was determined for CD4+ Foxp3+ Tregs and CD4+ Foxp3 CD45RA TEM cells. (A) Dose response curves and (B) non linear regression analyses of the binding data for the indicated cell populations. The numbers on the regression curves are the EC50s.
Fig 4:
Fig 4:. Dose-dependent changes in cytokines and chemokines in the plasma of T1D patients treated by ld-IL-2
Plasma cytokines and chemokines were measured by luminex assay, except for TGF-beta measured by ELISA. Radar chart representation of Treg/anti-inflammatory, Th1/Th17/inflammatory and Th2 cytokines at day 6 of follow-up (A). For each cluster of cytokines, patient projections according to the first two PCA components (capturing more than 70% of the overall variability) (B). Time course changes of representative cytokines (C). Data are shown as mean ± SEM of patients’ values normalized by individual baseline values at different time points.
Fig 5:
Fig 5:. Clustering of significantly regulated molecular signatures from PBMCs
For each IL-2 treatment dose (0.33, 1 and 3 MIU), Enrichment Map analysis was performed on significantly up- and down-regulated molecular signatures, in red and green, respectively (q-value < 0.05). Clusters have been labelled according to their main biological feature. Size of nodes (circles) is proportional to the number of genes in the signature; width of bars linking nodes is related to the Jaccard coefficient between two signatures. Signatures without connection are not shown.
Fig 6:
Fig 6:. Modifications of β-cell-specific T-cell responses and Treg numbers in ld-IL-2-treated T1D patients
PBMCs from T1D patients were analyzed for IFN-PBMCs from T1D patients were analyzed for IFN-γ T-cell responses against β-cell protein antigens (left Y axis) at different time points. Percentages of Tregs are shown by the dashed red line (right Y axis). Results are expressed as fold changes normalized to day 1 (baseline). Each graph represents one patient except the bottom right graph which represents the median and range fold changes of 4 patients treated at 3 MIU /day.
Fig 7:
Fig 7:. Anti-IL-2 antibodies study
Patients’ plasma were tested for the presence of anti-IL-2 antibodies at different time points. (A) Mean values for anti-IL-2 Ig in patients and healthy donors (HD) plasma and for anti-human IL-2 Ig in plasma of mice treated for 4 months with human IL-2. (B) Individual time course of human Ig anti-IL-2 among normal and low responders group. (C) Proliferation of the IL-2 dependent Kit 225 cells in presence of patients and HD plasma, or an anti-IL-2 neutralizing antibody.

References

    1. Sakaguchi S, Miyara M, Costantino CM, Hafler DA. FOXP3+ regulatory T cells in the human immune system. Nat Rev Immunol, 2010;10:490–500. - PubMed
    1. Ait-Oufella H, Salomon BL, Potteaux S, Robertson AK, Gourdy P, Zoll J et al. Natural regulatory T cells control the development of atherosclerosis in mice. Nat Med, 2006;12:178–80. - PubMed
    1. Campbell DJ, Koch MA. Phenotypical and functional specialization of FOXP3+ regulatory T cells. Nat Rev Immunol, 2011;11:119–30. - PMC - PubMed
    1. Wing K, Sakaguchi S. Regulatory T cells exert checks and balances on self tolerance and autoimmunity. Nat Immunol, 2010;11:7–13. - PubMed
    1. Bacchetta R, Passerini L, Gambineri E, Dai M, Allan SE, Perroni L et al. Defective regulatory and effector T cell functions in patients with FOXP3 mutations. J Clin Invest, 2006;116:1713–22. - PMC - PubMed

Publication types

MeSH terms