

doi: 10.1038/leu.2015.11.
Epub 2015 Jan 30.
Targeting PD1-PDL1 immune checkpoint in plasmacytoid dendritic cell interactions with T cells, natural killer cells and multiple myeloma cells
Affiliations
- PMID: 25634684
- PMCID: PMC5703039
- DOI: 10.1038/leu.2015.11
Item in Clipboard
Targeting PD1-PDL1 immune checkpoint in plasmacytoid dendritic cell interactions with T cells, natural killer cells and multiple myeloma cells
Leukemia.
2015 Jun.
No abstract available
Conflict of interest statement
The authors declare no conflict of interest.
Figures
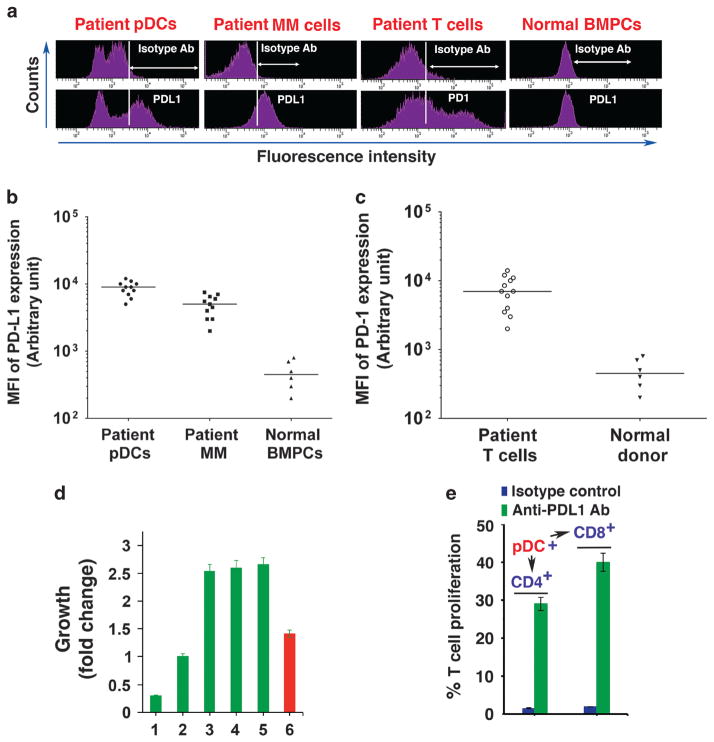
(a) PDL1 and PD1 expression analysis. pDCs, MM cells and T cells were isolated from patient BM samples using immunomagnetic cell separation kits specific for each cell type, followed by FACS. pDCs, MM cells and normal BM plasma cells (BMPCs) were stained with brilliant violet 421-conjugated PDL1 Ab, and PDL1 levels were analyzed using FACS. MM patient T cells were stained with Alexa-647-conjugated PD1 Ab and were examined for PD1 levels. A representative FACS analysis from 11 MM patients and 6 normal BM donors is shown. (b) Frequency of PDL1 expression on patient pDCs and tumor cells. Data are presented as mean fluorescence intensity (MFI) of PDL1 expression on pDCs and MM cells isolated from patient BM samples (n =11). BMPCs from normal healthy donors served as controls (n =6). Median MFI is shown for each cohort; P<0.0001 for both pDCs and patient MM cells versus normal BMPCs. (c) Frequency of PD1 expression on patient T cells. Data are presented as MFI of PD1 expression on T cells isolated from MM patient BM samples (n =12). BM mononuclear cells from normal healthy donors (n =6) served as controls. Median MFI values are presented for both patient and control groups; P<0.0001 for patient versus normal T-cell population. (d) Effect of anti-PDL1 Ab on pDC-induced patient MM cell growth. pDCs and autologous MM cells from patient BM samples (n =8) were cocultured in the presence of isotype control Ab or anti-PDL1 Ab for 72 h, and then analyzed for growth. pDCs (lane 1), MM cells (lane 2) and pDCs plus MM cells (lane 3) were cultured with isotype control Ab for 72 h, followed by growth analysis. pDCs and MM cells were also cocultured in the presence of anti-PDL1 Ab (lane 4: 5 μg/ml; lane 5: 10 μg/ml) and analyzed for growth (mean ± s.d.; P<0.005; n =3). CpG oligodeoxynucleotides-treated (1 μg/ml) cocultures of pDCs and MM cells (lane 6) served as a positive control for MM cell growth inhibition. Cocultures of pDCs and MM cells were performed at 1:5 (pDC:MM) ratio. Growth assays were performed using 1 × 10⁴ pDCs and 5 × 10⁴ MM cells in 200 μl media in 96 well plates. Error bars indicate s.d. (e) PDL1–PD1 blockade triggers T-cell proliferation. pDCs from MM patients (n =10) were cocultured with autologous T cells using 1:10 (pDC:T) ratio in the presence of isotype-matched control Ab or anti-PDL1 Ab (5 μg/ ml) for 5 days, and CD4+ or CD8+ T cells were quantified using CellTrace Violet-Cell proliferation Kit by FACS (mean ±s.d.; P<0.05, n =3).
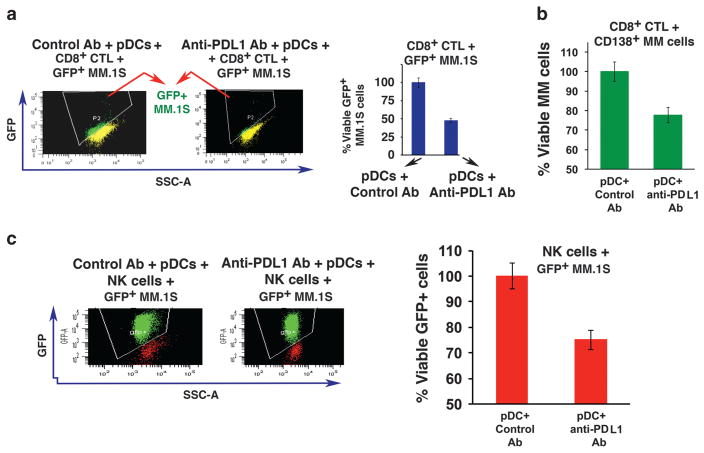
Anti-PDL1 Ab induces MM-specific CD8+ CTLs and NK cell-mediated cytotoxicity. (a) Freshly isolated CD8+ T cells from MM patient BM (n =10) were cocultured with autologous pDCs at 1:10 (pDC:T) ratio in the presence of isotype-matched control Ab or anti-PDL1 Ab (5 μg/ml) for 5 days; then GFP+ MM.1S cells were added for 3 days (E:T ratio 20:1 for CD8+ T:GFP+ MM.1S), followed by quantification of viable GFP+ MM.1S cells by FACS (right panel, bar graph) (mean ±s.d.; P<0.03). The loss of viable GFP signal is shown in a representative histogram (left panel), indicating MM cell lysis by CD8+ CTLs. (b) CD8+ T cells from MM patients (n =8) were prestained with CellTrace Violet and cultured with autologous pDCs at 1:10 (pDC:T) ratio in the presence of isotype-matched control Ab or anti-PDL1 Ab (5 μg/ml) for 5 days; then autologous CD138+ MM cells were added for another 2 days (E:T ratio 20:1, CD8+ T:MM), followed by staining with 7-AAD and fluorescein isothiocyanate-conjugated anti-CD138 Ab for quantitative analysis of CTL-mediated cytotoxicity against MM cells using FACS. MM cells were also incubated without CD8+ T cells to measure baseline apoptosis. The loss of viable CD138+ MM cells indicates MM cell lysis by anti-PDL1-activated CTLs (mean ±s.d.; P<0.05). (c) Freshly isolated NK cells from MM patient BM (n =5) were cocultured with autologous pDCs at 1:10 (pDC:NK) ratio in the presence of anti-PDL1 Ab or isotype-matched control Ab (5 μg/ml) for 5 days; then GFP+ MM.1S cells were added for another 3 days (E:T ratio 10:1, NK:GFP+ MM.1S), followed by quantification of viable GFP+ MM.1S cells by FACS (right panel, bar graph) (mean ±s.d.; P<0.05). The loss of viable GFP signal is shown in a representative histogram (left panel), indicating NK cell-mediated MM cell lysis.
Comment in
-
The failure of immune checkpoint blockade in multiple myeloma with PD-1 inhibitors in a phase 1 study.Leukemia. 2015 Jul;29(7):1621-2. doi: 10.1038/leu.2015.104. Epub 2015 May 19. Leukemia. 2015. PMID: 25987102 No abstract available.
References
-
- Atanackovic D, Luetkens T, Kroger N. Coinhibitory molecule PD-1 as a potential target for the immunotherapy of multiple myeloma. Leukemia. 2014;28:993–1000. - PubMed
Publication types
MeSH terms
Substances
Grants and funding
LinkOut - more resources
Full Text Sources
Other Literature Sources
Medical
Research Materials
