. 2015 Apr 1;21(7):1741-51.
doi: 10.1158/1078-0432.CCR-14-1959. Epub 2015 Jan 29.

Loss of SOD3 (EcSOD) Expression Promotes an Aggressive Phenotype in Human Pancreatic Ductal Adenocarcinoma

Affiliations

Loss of SOD3 (EcSOD) Expression Promotes an Aggressive Phenotype in Human Pancreatic Ductal Adenocarcinoma

Brianne R O'Leary et al. Clin Cancer Res. .

Abstract

Purpose: Pancreatic ductal adenocarcinoma (PDA) cells are known to produce excessive amounts of reactive oxygen species (ROS), particularly superoxide, which may contribute to the aggressive and refractory nature of this disease. Extracellular superoxide dismutase (EcSOD) is an antioxidant enzyme that catalyzes the dismutation of superoxide in the extracellular environment. This study tests the hypothesis that EcSOD modulates PDA growth and invasion by modifying the redox balance in PDA.

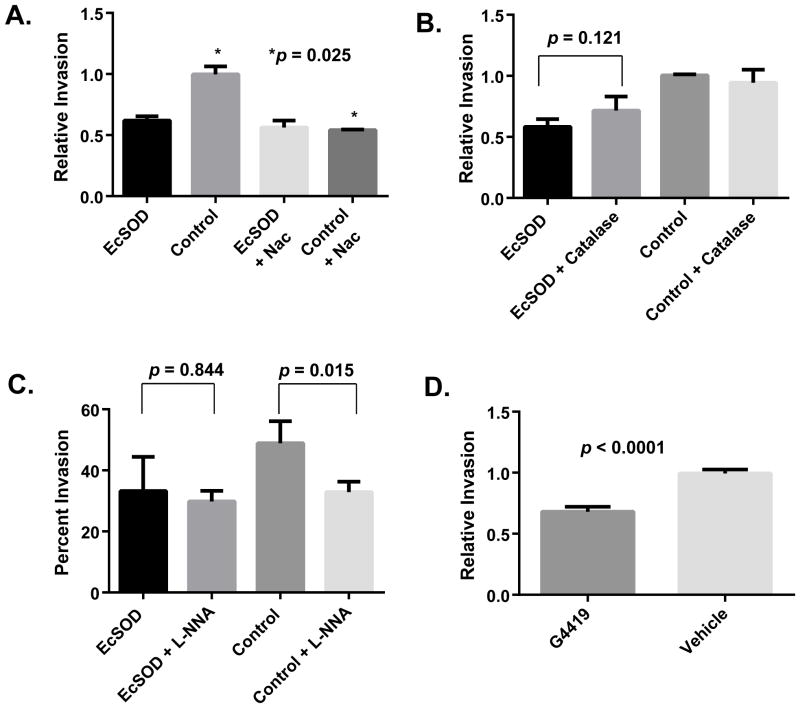
Experimental design: We evaluated the prognostic significance of EcSOD in a human tissue microarray (TMA) of patients with PDA. EcSOD overexpression was performed in PDA cell lines and animal models of disease. The impact of EcSOD on PDA cell lines was evaluated with Matrigel invasion in combination with a superoxide-specific SOD mimic and a nitric oxide synthase (NOS) inhibitor to determine the mechanism of action of EcSOD in PDA.

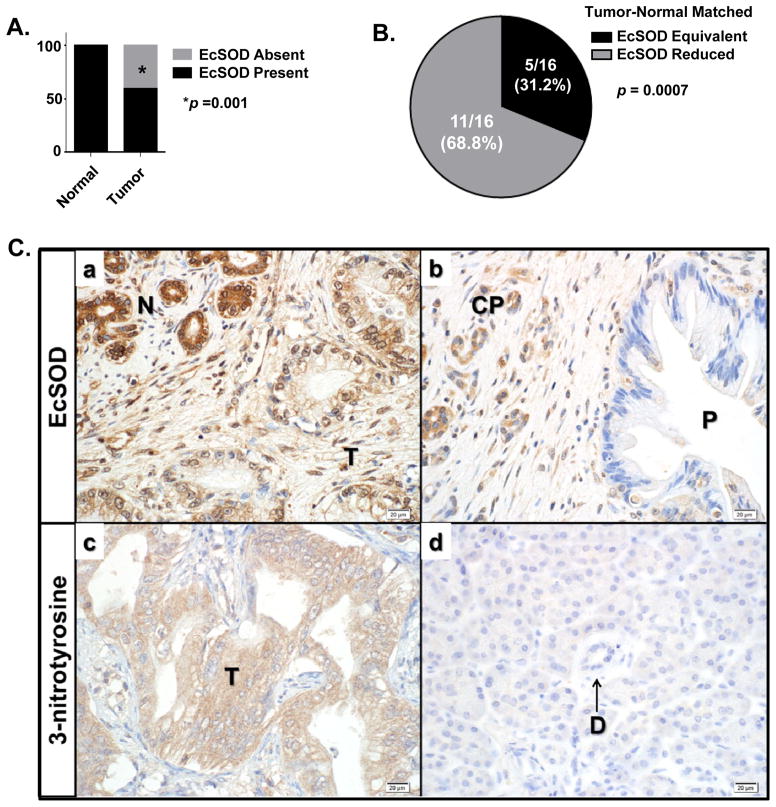
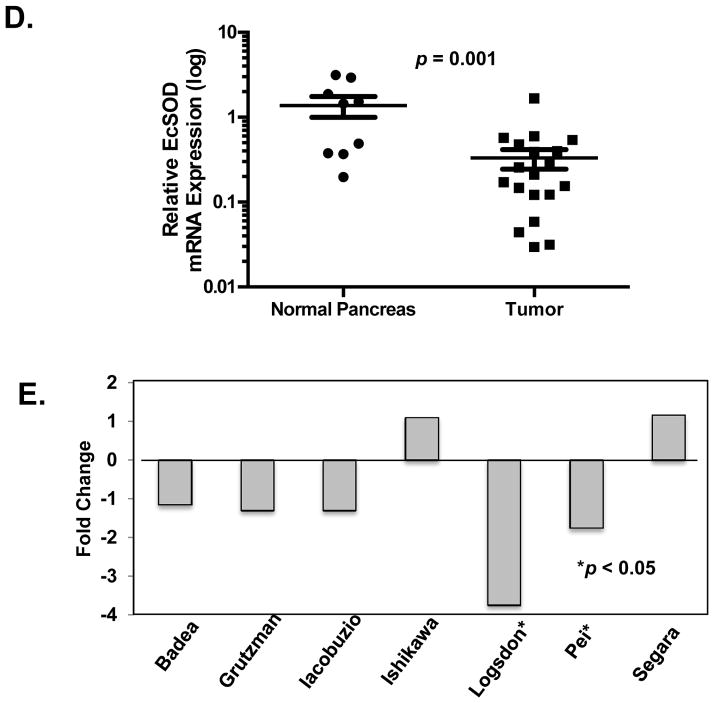
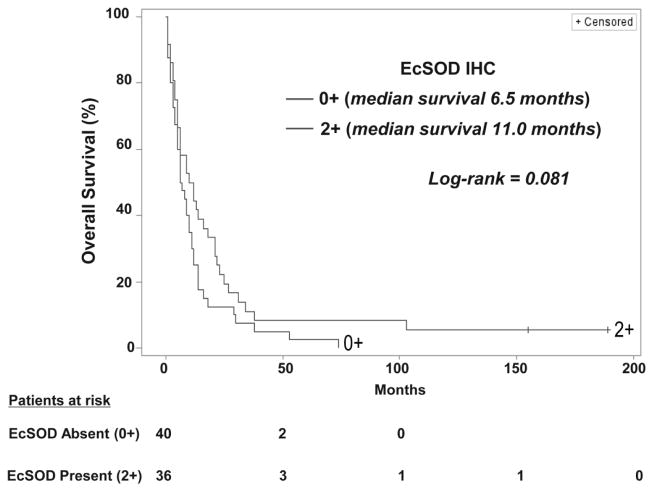
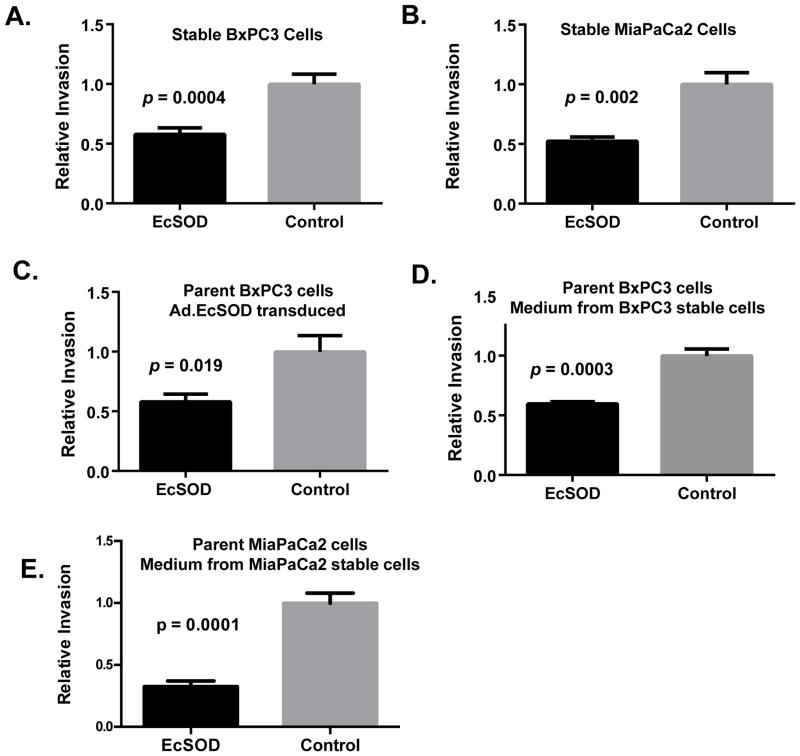
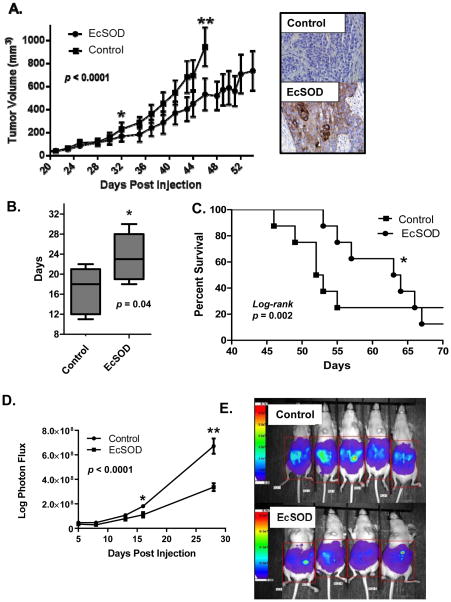
Results: Loss of EcSOD expression is a common event in PDA, which correlated with worse disease biology. Overexpression of EcSOD in PDA cell lines resulted in decreased invasiveness that appeared to be related to reactions of superoxide with nitric oxide. Pancreatic cancer xenografts overexpressing EcSOD also demonstrated slower growth and peritoneal metastasis. Overexpression of EcSOD or treatment with a superoxide-specific SOD mimic caused significant decreases in PDA cell invasive capacity.

Conclusions: These results support the hypothesis that loss of EcSOD leads to increased reactions of superoxide with nitric oxide, which contributes to the invasive phenotype. These results allow for the speculation that superoxide dismutase mimetics might inhibit PDA progression in human clinical disease.


Conflict of interest statement

Conflicts of interest: Dr. Beardsley serves as a member of the boards of directors of Galera, Euclises Pharmaceuticals and Epigenetx, serves as a paid consultant to Confluence Life Sciences, and holds equity positions in Galera, Euclises, Epigenetx, and Confluence. The remaining authors have no conflicts of interest to disclose.

Figures

Figure 1
Figure 1. EcSOD expression is significantly decreased in patient samples of pancreatic adenocarcinoma (PDA) relative to normal pancreatic ductal epithelium
(A) Immunohistochemistry (IHC) was performed to evaluate EcSOD expression on a tissue microarray of normal pancreas and PDA which contains the following specimens: 42 PDA, 20 normal pancreas, and 8 chronic pancreatitis, each arrayed in duplicate. EcSOD expression (cytoplasmic in distribution) was scored as present or absent. Among core biopsies from normal pancreatic ductal epithelium, 28/28 (100%) had robust EcSOD expression while 18/44 core biopsies from PDA lacked EcSOD expression (41%). p = 0.001. The sparse stroma of normal pancreas and dense stroma of malignant tumors were devoid of EcSOD expression. (B) IHC was performed on individual surgical resection specimens from patients with PDA. Staining in tumors was assessed relative to non-neoplastic ductal epithelium and islets of Langerhans, which each demonstrate strong staining. Staining was relative to normal pancreas and was either isointense or reduced intensity. Regions of normal pancreas showed intact EcSOD expression in all cases, whereas adjacent malignant ductal epithelium showed diminished EcSOD expression in 11/16 specimens p = 0.0007. (C) Immunoreactive EcSOD was reduced and immunoreactive 3-nitrotyrosine was increased in PDA tissue versus normal pancreatic ductal epithelium. Panel Ca) EcSOD was reduced in malignant pancreatic ducts (T) compared to adjacent normal pancreatic ducts (N). Panel Cb) Evaluation of EcSOD in tumor tissue showed that expression was reduced in precursor PanIN lesions (P) and diseased pancreas (chronic pancreatitis; CP). Panel Cc and Cd) IHC for 3-nitrotyrosine (3-NT) showed 12/17 (70.6%) PDA samples demonstrated 3-NT staining in malignant tumor (T) ducts (Panel Cc) compared to 0/17 (0%) of the normal pancreatic ductal (D) epithelium (Panel Cd). Original magnification of all photomicrographs is 400×. (D) Normal pancreas and pancreatic adenocarcinoma human cDNA samples from a Tissue Scan Real-Time pancreatic cancer qPCR Panel and specimens obtained from surgical resection were assessed for the mRNA expression of EcSOD. Combined there were 13 normal pancreas and 19 PDA samples evaluated. The data were normalized to β-actin expression and are presented as fold-change (log scale) of tumor samples compared to normal. Tumor specimens showed significant reduction of EcSOD expression compared to normal pancreas. p = 0.001. (E) A thorough analysis of existing Oncomine data revealed a consistent decrease in EcSOD mRNA expression relative to normal pancreas in 5/7 studies; 2 studies were highly significant. p-values represent data provided by the primary study referenced. p < 0.05.
Figure 2
Figure 2. Loss of EcSOD expression is associated with decreased long-term survival in patients with PDA
Biopsies from 76 patients with PDA were evaluated for EcSOD expression using IHC. Patients with no expression (0+) and robust EcSOD expression (2+) in their PDA specimens were compared on univariate analysis. PDA patients with loss of EcSOD expression had a significant reduction in median survival (6.5 months vs. 11.0 months for those with intact EcSOD).
Figure 3
Figure 3. Stable overexpression of EcSOD attenuates the malignant phenotype of human pancreatic cancer cell lines
(A) Stably overexpressing BxPC3 cells and (B) MiaPaCa2 cells were plated to assess colony formation after 2 weeks. Plating efficiency for both Bx-EcSOD and Mia-EcSOD cells decreased compared to control cells. Data represent the relative mean ± SE. p = 0.015 for BxPC3 and 0.044 for MiaPaCa-2. (C) Growth of overexpressing cells (Bx-EcSOD and Bx-Control) was examined for a total of 96 h. Doubling time in the Bx-EcSOD cells after overexpression increased compared to control cells. Data represent the mean ± SE of cell population doubling time in hours. p = 0.031.
Figure 4
Figure 4. EcSOD overexpression significantly decreases human pancreatic tumor cell invasiveness in vitro
The effect of EcSOD expression on invasion using Matrigel invasion chambers was examined. In all graphs cells were seeded at 2×10⁵ and allowed to incubate for 22–24 h before being analyzed. (A) Invasion of cells generated to stably overexpress EcSOD or control vector measured by MTT (Bx-EcSOD and Bx-Control). p = 0.0004. (B) Invasion of cells generated to stably overexpress EcSOD or control vector measured by cell counting (Mia-EcSOD, mean 135 cells ± 28 cells and Mia-Control, mean 250 cells ± 49 cells, p = 0.002). (C) Effect of EcSOD transduction (MOI 25 for 72 h) on parent BxPC3 cell invasion measured by MTT. p = 0.019. (D) Invasion of parent BxPC3 cells incubated with conditioned media harvested after 48 h from stably overexpressing cells measured by MTT (Bx-EcSOD and Bx-Control). p = 0.0003. (E) Invasion of parent MiaPaCa2 cells incubated with conditioned media harvested after 48h from stably overexpressing cells measured by cell counting (Mia-EcSOD, mean 73 cells ± 11 cells and Mia-Control, mean 227 cells ± 27 cells. p = 0.0001).
Figure 5
Figure 5. Human pancreatic tumor cell invasion is inhibited by EcSOD activity through inhibition of superoxide and nitric oxide generating radicals
(A) The effect of N-acetylcysteine (NAC) on stable cell (Bx-EcSOD and Bx-Control) invasion was assessed. 20 mM NAC had no effect on the invasion of Bx-EcSOD cells but showed a significant reduction on invasion of Bx-Control cells. Data represent the mean ± SE of relative invasion compared to control. p = 0.025. Comparison of all groups, p = 0.0014. (B) The effect of catalase on stable cell (Bx-EcSOD and Bx-Control) invasion was examined. Addition of 10 IU/mL of catalase showed no effect on tumor cell invasion. Data represent the mean ± SE of percent invasion (invasion/migration *100) compared to control. EcSOD vs. EcSOD + Catalase, p = 0.12. Comparison of all groups, p = 0.111. (C) The effect of NG-nitro-L-arginine (L-NNA) on stable cell invasion was determined. Incubation with 100 μM of LNNA had no effect on Bx-EcSOD invasion (p=0.84) but showed a significant reduction on invasion of Bx-Control cells. p=0.015. Overall statistical evaluation p = 0.004. Data represent the mean ± SE of percent invasion (invasion/migration *100). (D) 50 μM of EcSOD mimetic GC4419 was examined for effects on the invasion of parent BxPC3 pancreatic cancer cells. 50 μM of GC4419 showed a significant decrease in invasion of BxPC3 cells compared to vehicle. p <0.0001. Data represent the mean ± SE of relative invasion compared to vehicle.
Figure 6
Figure 6. Stable overexpression of EcSOD reduces tumor xenograft growth, doubling time, animal survival, and peritoneal growth in athymic nude mice
BxPC3 cells stably expressing EcSOD or Empty vector (Control) were injected into athymic nude mice hind limbs (8 animals per group) on day 1. When maximum tumor diameter exceeded 15 mm mice were sacrificed. (A) Tumor growth curves demonstrate that EcSOD tumor volumes were significantly smaller (p = 0.03) starting on day 32 and remained significantly smaller until day 46 (p = 0.0001) when the first mouse met criteria for euthanasia. Overall comparison of growth, p <0.0001. IHC was performed in 5 tumors to confirm EcSOD protein expression was present in the EcSOD cell lines compared to empty vector control (Inset). (B) Box and whiskers plot demonstrating the minimum, maximum and mean days it took for the tumor to double from a diameter of 6 mm to 12 mm. EcSOD tumors took significantly longer time to double (23 vs. 17 days, p=0.04,). (C) Kaplan-Meier survival plot demonstrates that mice baring EcSOD expressing BxPC3 tumors had prolonged median survival compared to mice baring Empty vector tumors (63 vs. 52 days p = 0.002, log-rank). (D) Following intraperitoneal injection of 1 × 10⁷ Bx-EcSOD and Bx-Control cells animals were imaged starting 5 days post-injection up to 28 days when the control group met criteria for sacrifice. A region of interest was placed around each mouse image and total photon flux was quantified (AMIView software) and data reported as mean ±SE of total photon flux (photons per second). Values obtained show statistically significant differences in growth between cell types at 16 and 28 days post-injection. *p = 0.015, **p = 0.003. Overall statistical comparison between curves, p < 0.0001. (E) Representative image of BLI of mice 28 days post-intraperitoneal injections of luciferase-expressing Bx-EcSOD or Bx-Control cells. A region of interest (as shown) was placed around each mouse and total photon flux was quantified. Mice injected with luciferized Bx-EcSOD cells showed statistically less tumor burden than control mice.

References

    1. Carlsson LM, Jonsson J, Edlund T, Marklund SL. Mice lacking extracellular superoxide dismutase are more sensitive to hyperoxia. Proceedings of the National Academy of Sciences of the United States of America. 1995;92(14):6264–8. - PMC - PubMed
    1. Jung O, Marklund SL, Geiger H, Pedrazzini T, Busse R, Brandes RP. Extracellular superoxide dismutase is a major determinant of nitric oxide bioavailability: in vivo and ex vivo evidence from ecSOD-deficient mice. Circulation research. 2003;93(7):622–9. - PubMed
    1. Marklund SL. Extracellular superoxide dismutase in human tissues and human cell lines. The Journal of clinical investigation. 1984;74(4):1398–403. - PMC - PubMed
    1. Ridnour LA, Oberley TD, Oberley LW. Tumor suppressive effects of MnSOD overexpression may involve imbalance in peroxide generation versus peroxide removal. Antioxidants & redox signaling. 2004;6(3):501–12. - PubMed
    1. Oberley LW, Oberley TD, Buettner GR. Cell division in normal and transformed cells: the possible role of superoxide and hydrogen peroxide. Medical hypotheses. 1981;7(1):21–42. - PubMed

Publication types

LinkOut - more resources