. 2015 Apr 17;290(16):10018-36.
doi: 10.1074/jbc.M114.602268. Epub 2015 Jan 29.

Quantitative analysis of receptor tyrosine kinase-effector coupling at functionally relevant stimulus levels

Affiliations

Quantitative analysis of receptor tyrosine kinase-effector coupling at functionally relevant stimulus levels

Simin Li et al. J Biol Chem. .

Abstract

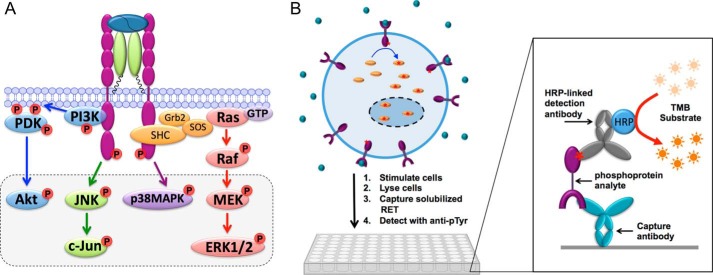
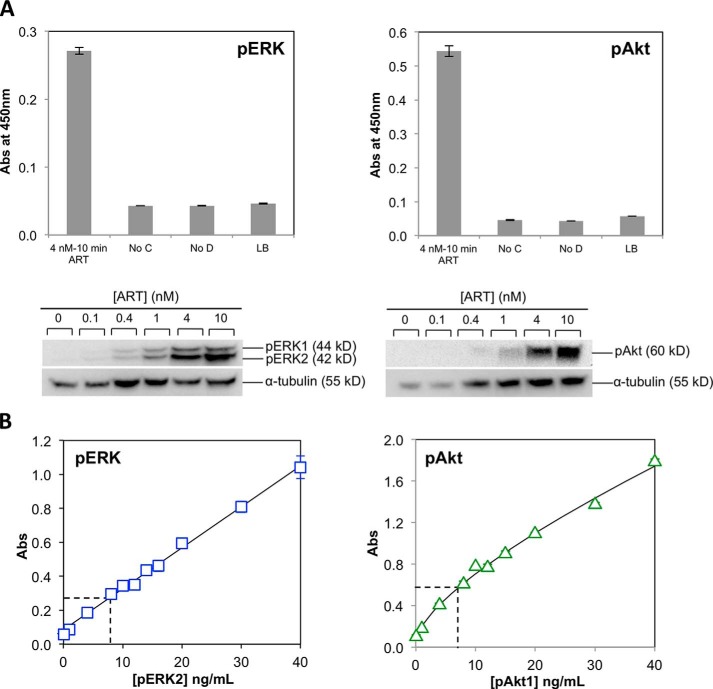
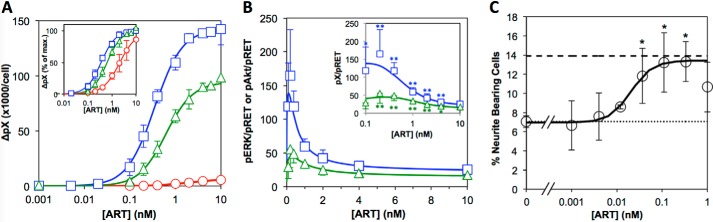
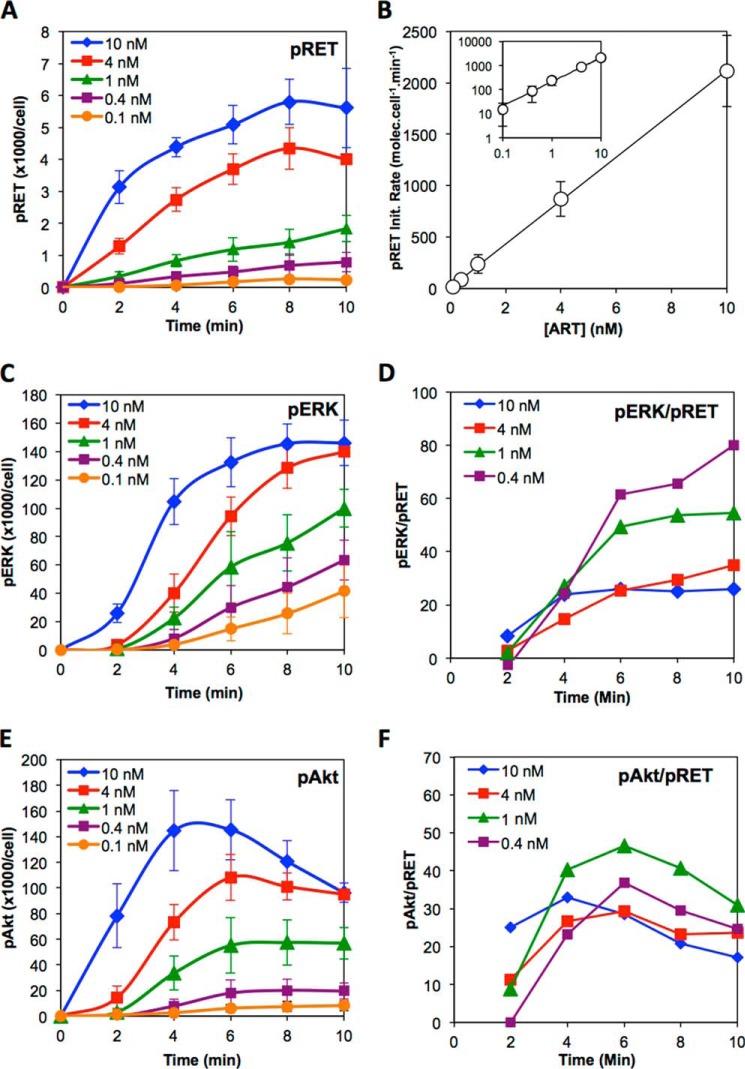
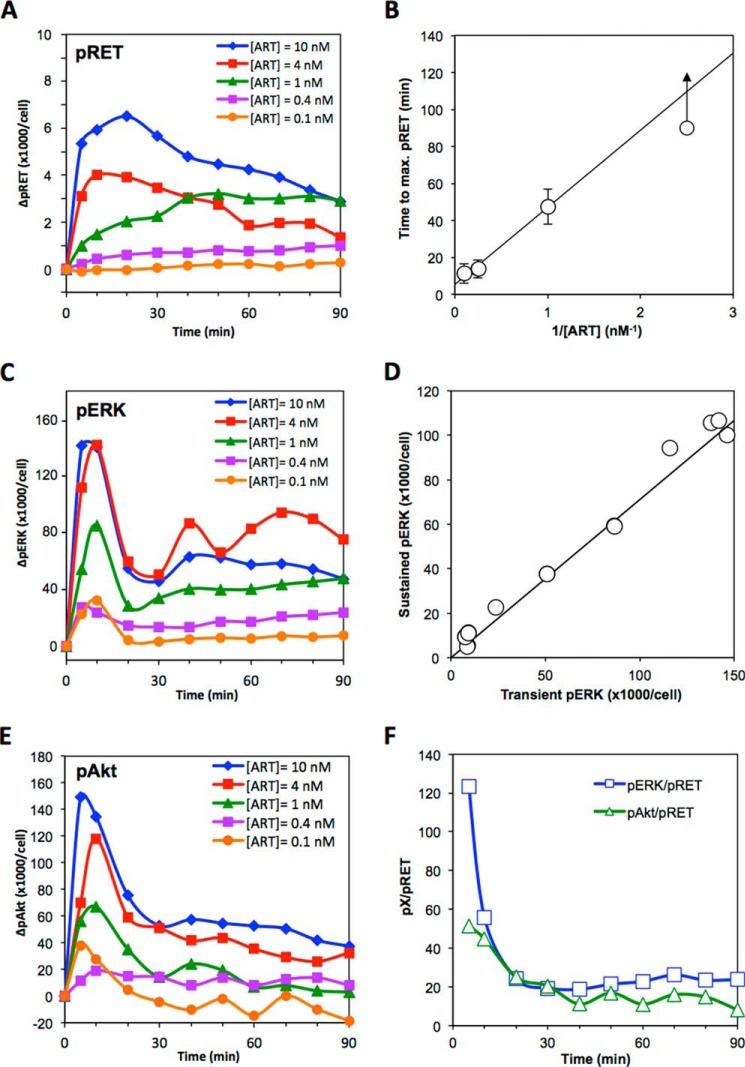
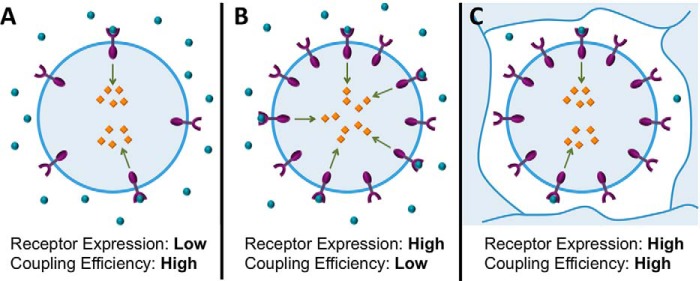
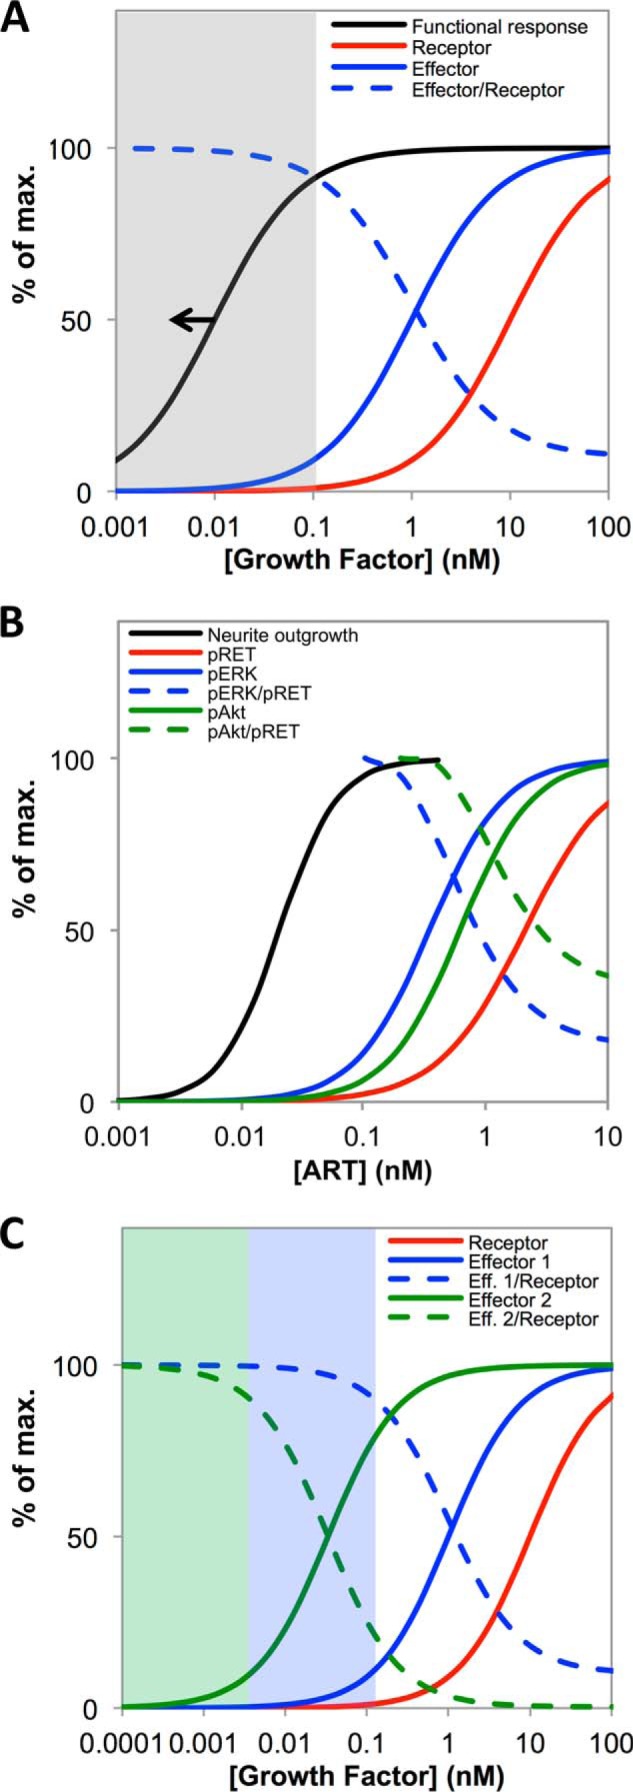
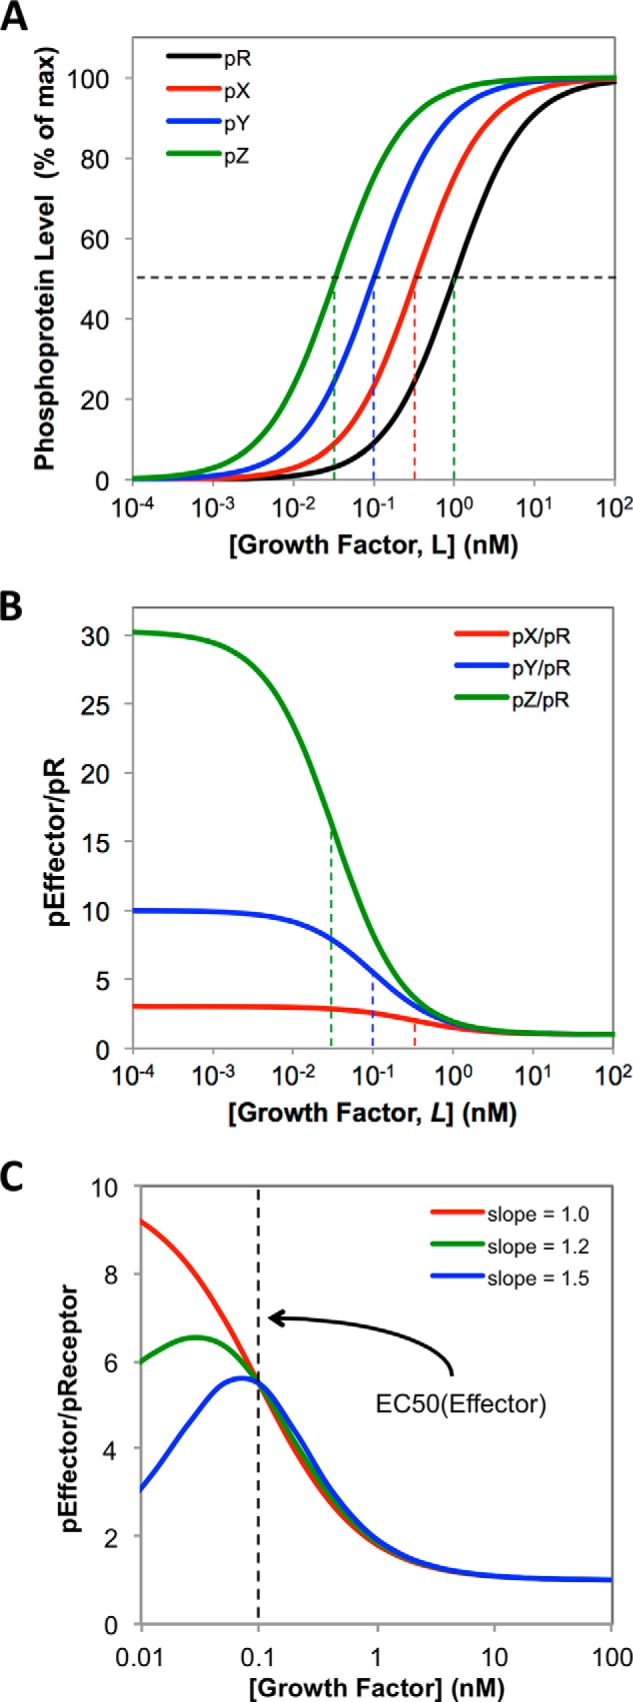
A major goal of current signaling research is to develop a quantitative understanding of how receptor activation is coupled to downstream signaling events and to functional cellular responses. Here, we measure how activation of the RET receptor tyrosine kinase on mouse neuroblastoma cells by the neurotrophin artemin (ART) is quantitatively coupled to key downstream effectors. We show that the efficiency of RET coupling to ERK and Akt depends strongly on ART concentration, and it is highest at the low (∼100 pM) ART levels required for neurite outgrowth. Quantitative discrimination between ERK and Akt pathway signaling similarly is highest at this low ART concentration. Stimulation of the cells with 100 pM ART activated RET at the rate of ∼10 molecules/cell/min, leading at 5-10 min to a transient peak of ∼150 phospho-ERK (pERK) molecules and ∼50 pAkt molecules per pRET, after which time the levels of these two signaling effectors fell by 25-50% while the pRET levels continued to slowly rise. Kinetic experiments showed that signaling effectors in different pathways respond to RET activation with different lag times, such that the balance of signal flux among the different pathways evolves over time. Our results illustrate that measurements using high, super-physiological growth factor levels can be misleading about quantitative features of receptor signaling. We propose a quantitative model describing how receptor-effector coupling efficiency links signal amplification to signal sensitization between receptor and effector, thereby providing insight into design principles underlying how receptors and their associated signaling machinery decode an extracellular signal to trigger a functional cellular outcome.

Keywords: Akt PKB; Artemin; Extracellular Signal-regulated Kinase (ERK); Kinetics; Mitogen-activated Protein Kinase (MAPK); Neurite Outgrowth; RET; Signal Gain; Signal Transduction; Systems Biology.


Figures

FIGURE 1.
FIGURE 1.
A, simplified scheme identifying key signaling pathways activated by the RET receptor. The dashed box highlights the six signaling effectors examined in this study. B, scheme illustrating experimental protocol for measuring phosphoprotein levels using quantitative immunoassays.
FIGURE 2.
FIGURE 2.
Validation and calibration data for pERK and pAkt ELISAs. A, ELISA data for pERK (left) and pAkt (right) showing that, in each case, lysate from cells treated with 4 nm ART for 10 min gives a strong positive signal, whereas negative controls in which capture antibody (No C), detection antibody (No D), or cell lysate (LB) was omitted gave only a low background signal. Plots show the averaged data from duplicate wells. Error bars are the difference between the duplicates. Results are representative of at least three independent experiments. Shown below are dose-response data for activation of ERK (left) and Akt (right) measured by Western blotting. Cell lysates were obtained by stimulating the cells with the stated concentration of ART for 10 min. α-Tubulin was used as loading control. B, calibration curves constructed using purified recombinant activated mouse ERK2 (left) in the pERK ELISA or human pAkt1 (right) in the pAkt ELISA, added to cell lysate from unstimulated cells. Plots show the averaged data from duplicate wells, shown as absorbance at 450 nm. Error bars are the difference between the duplicates. The dashed lines show the signal achieved in the same experiment for lysate from NB41A3-GFRα3 cells after stimulation with 4 nm ART for 10 min. The averaged data from three independent experiments were used to estimate that the lysate contained 9.9 ± 2.0 ng/ml pERK, corresponding to 142,000 ± 33,000 pERK molecules/cell, and 9.4 ± 1.2 ng/ml pAkt, corresponding to 95,000 ± 12,000 pAkt molecules/cell.
FIGURE 3.
FIGURE 3.
A, dose-response data for activation of pRET (circles), pERK (squares), and pAkt (triangles) after stimulation of NB41A3-mGFRα3 cells with the stated concentration of ART for 10 min. The ordinate shows the average number of phosphoprotein molecules per cell. Plots show the averaged data from at least three independent experiments. Error bars are standard deviations among the separate experiments. Solid lines represent the best fits to a logistic equation, as described under “Experimental Procedures.” Inset plot shows the same data plotted as percent maximum signal, to highlight the different EC50 values for the three phosphoproteins. B, ratio of pERK/pRET (squares) or pAkt/pRET (triangles) for each ART concentration tested. Solid lines represent expected values derived from the curve fits in A as described in the text. Error bars are the standard deviations, propagated from the errors in A as described under “Experimental Procedures.” Data are shown for [ART] ≥0.1 nm only, as at lower ART the propagated errors were very large. Inset plot shows the same data but with a logarithmic concentration axis, to better show the data at low ART concentrations. Data points indicated * or ** are values that are significantly greater than the corresponding value for 10 nm ART at the level of p < 0.05 or <0.01, respectively, as determined using an unpaired two-tailed Student's t test. C, dose-response data for the ART-dependent differentiation of the NB41A3-mGFRα3 cells as measured by neurite outgrowth. Plotted is the percentage of cells possessing neurites with a cumulative length at least equaling the diameter of the cell body, after incubation with the stated concentration of ART for 4 days as described under “Experimental Procedures.” The dotted line represents the value for cells treated in parallel but without ART. The dashed line represents the result obtained with 1 μm retinoic acid, as positive control. Data show the average of three replicate experiments performed on the same day. Error bars are standard deviations. The solid line is the best fit to a logistic equation; the data for 1 nm ART were not included in the fit. Asterisks indicate treatment conditions that were statistically distinct from the no ART control cells at the level of p < 0.05, as determined by analysis of variance with Fisher's LSD post hoc test.
FIGURE 4.
FIGURE 4.
Time course data showing how the levels of pRET (A), pERK (C), and pAkt (E) change after treatment of cells with the stated concentration of ART for 0, 2, 4, 6, 8, or 10 min. Data are the average of at least three independent experiments. Solid lines are smoothed interpolations of the data. Error bars are standard deviations between the independent experiments. B, rate of pRET formation in the first 2 min after stimulation plotted against ART concentration. The solid line is a linear least squares fit passing through the origin. The inset plot shows the same data and curve fit, but using logarithmic axes to better show the data at low [ART]. D, ratio of pERK/pRET plotted against time after stimulation, calculated using the data from A and C. F, ratio of pAkt/pRET against time after stimulation, calculated using the data from A and E.
FIGURE 5.
FIGURE 5.
Time course data showing how the levels of pRET (A), pERK (C), and pAkt (E) change after treatment of cells with the stated concentration of ART for 0–90 min. Data are the average of at least three independent experiments. Solid lines are smoothed interpolations of the data. Error bars are omitted for clarity. B, time for RET phosphorylation to reach its maximal level plotted against 1/ART concentration, showing the reciprocal relationship between these quantities. Plots show the averaged data from at least four independent experiments. Error bars are the standard deviations between the independent experiments. The data point for 1/[ART] = 2.5 nm−1 (i.e. [ART] = 0.4 nm) is a lower limit, reflecting the fact that at this low ART concentration the time to maximum pRET appears to exceed the 90-min time frame of the experiment. D, levels of pERK observed after 60 min plotted against the pERK levels seen at 10 min, over a range of ART concentrations from 0.001–10 nm. Each data point represents a pair of measurements made at the same ART concentration. The solid line is a linear least squares fit passing through the origin. F, ratio of pERK/pRET (squares) or pAkt/pRET (triangles), measured as a function of time after stimulation with 0.4 nm ART.
FIGURE 6.
FIGURE 6.
Relative amplitudes of signaling through divergent downstream pathways as a function of ART concentration and of time after stimulation. A, ratio of pERK/pAkt at 10 min after stimulation with the stated concentration of ART. The solid line represents expected values for the pERK/pAkt ratio, derived from the curve fits in Fig. 3A as described in the text. Error bars are the standard deviations, propagated from the errors in Fig. 3A as described under “Experimental Procedures.” Inset plot shows the same data but with a logarithmic concentration axis, to better show the data at low ART concentrations. Data points indicated * or ** are values that are significantly greater than the corresponding value for 10 nm ART at the level of p < 0.05 or <0.01, respectively, as determined using an unpaired two-tailed Student's t test. B, time course data, measured using the BioPlex multiplexed bead array assay, showing how levels of pAkt, pMEK, pJNK, and p-p38 MAPK vary over 0–60 min after stimulation of NB41A3-GFRα1/3 cells with 5 nm ART. Data are plotted as % of the maximum signal observed for each phosphoprotein (pX) and show representative results of 2–3 independent experiments. The solid lines are smoothed interpolations. Comparison of lag times observed for activation of MEK and ERK (C) and for JNK and c-Jun (D), after stimulation of NB41A3-GFRα1/3 cells with 5 nm ART, measured using Bio-Plex multiplexing immunoassay technology. The time course for formation of pRET in the same cells under the same stimulation conditions, measured using the KIRA ELISA, is shown for comparison. Data represent the average of 2 or 3 independent experiments. The results show that, in each case, consecutive steps in the same signaling pathway display similar lag times. E, variation in the ratios of pEffector/pRET as a function of time after stimulation for each of the four phosphoproteins shown in B. The data are relative to 100% of the maximum observed signal in each case. Consequently, the plots show how the receptor-effector coupling ratio for a given phosphoprotein evolves over time, but the scaling of the data for the different phosphoproteins is arbitrary. The solid lines are smoothed interpolations.
FIGURE 7.
FIGURE 7.
Schematic illustrating circumstances under which a high receptor-effector coupling efficiency might be important for function. Under conditions where the concentration of activating GF (blue circles) is not limiting with respect to receptor, a given level of activated effector (orange lozenges) can be generated either by activation of a small number of receptors that display high receptor-effector coupling (A) or, alternatively, by activating a larger number of receptors that display lower receptor-effector coupling (B). However, if the GF concentration is stoichiometrically limiting, as for example in the case of a highly potent GF that is present at its very low functional concentration in a restricted volume of extracellular fluid space (C), the number of activated receptors will be limited by the number of available GF molecules. Under these conditions, achieving the necessary level of activated effectors will require a high receptor-effector coupling efficiency, no matter how many receptor molecules are present, because the number of activated receptors at a given time is limited by the low available GF concentration.
FIGURE 8.
FIGURE 8.
Functional implications of receptor-effector coupling efficiency. A, plots of Equations 5 and 6 (see “Appendix”), for hypothetical receptor (red line) and effector (blue line) dose-response curves, showing that if EC50(effector) < EC50(receptor) then the receptor-effector coupling ratio (dashed line) will necessarily increase with decreasing GF concentrations, reaching a maximum at [GF] < EC50(effector). The GF concentration range giving maximal (>90%) receptor-effector coupling is shaded in gray. If the system is one for which, for whatever reason, a functional response requires maximal receptor-effector coupling, then the dose-response curve for function will lie around or to the left of the black line. B, corresponds to A but plotted using the curve fits for the experimental data shown in Fig. 3 (but omitting the experimental data points, for clarity) to illustrate the behavior observed experimentally in this study for pRET (red line), pERK (blue line), pAkt (green line), and neurite outgrowth (black line). C, plots based on Equations 5 and 6 showing the expected behavior for a hypothetical receptor (EC50 = 10 nm, red line) that activates effectors in two divergent signaling pathways with very different EC50 values (1 nm, blue line, and 0.033 nm, green line). The plot shows that pEffector/pReceptor coupling for the two effectors (dashed blue and green lines) is maximal at correspondingly different GF concentrations, such that functional responses coupled to the two signaling pathways might occur over distinct GF concentration ranges, as described under the “Appendix.”
FIGURE 9.
FIGURE 9.
A, calculated dose-response curves, using Equation 5 (see “Appendix”), for the GF-dependent phosphorylation of a hypothetical receptor (pR) and three hypothetical downstream effector phosphoproteins, pX, pY, and pZ, where EC50 values are pR = 1 nm, pX = 0. 33 nm, pY = 0.1 nm, pZ = 0.033 nm, and all slopes have value 1.0. The vertical dashed lines indicate the EC50 value for each curve. B, calculated effector/receptor ratios, pX/pR, pY/pR, and pZ/pR, for the dose-response curves shown in A, calculated using Equation 6 (see “Appendix”). The dashed lines show the EC50 values for the corresponding effector dose-response curves from A. C, curves calculated using Equation 6 (see “Appendix”), showing how the dose dependence of the effector/receptor coupling ratio is affected if slope(effector) < slope(receptor). For all curves, the receptor is assumed to have EC50 = 1 nm and slope = 1.0. The red, green, and blue curves are calculated for effectors with EC50 = 0.1 nm (dashed line) and slopes of 1.0, 1.2, or 1.5, respectively.

Similar articles

Cited by

References

    1. Janes K. A., Lauffenburger D. A. (2013) Models of signalling networks–what cell biologists can gain from them and give to them. J. Cell Sci. 126, 1913–1921 - PMC - PubMed
    1. Shankaran H., Resat H., Wiley H. S. (2007) Cell surface receptors for signal transduction and ligand transport: a design principles study. PLoS Comput. Biol. 3, e101. - PMC - PubMed
    1. Haugh J. M. (2012) Cell regulation: a time to signal, a time to respond. Bioessays 34, 528–529 - PMC - PubMed
    1. Chew Y. H., Smith R. W., Jones H. J., Seaton D. D., Grima R., Halliday K. J. (2014) Mathematical models light up plant signaling. Plant Cell 26, 5–20 - PMC - PubMed
    1. Androulakis I. P., Kamisoglu K., Mattick J. S. (2013) Topology and dynamics of signaling networks: in search of transcriptional control of the inflammatory response. Annu. Rev. Biomed. Eng. 15, 1–28 - PubMed

Publication types

MeSH terms

LinkOut - more resources