. 2015 Mar;167(3):1117-35.
doi: 10.1104/pp.114.253120. Epub 2015 Jan 29.

Perturbation of maize phenylpropanoid metabolism by an AvrE family type III effector from Pantoea stewartii

Affiliations

Perturbation of maize phenylpropanoid metabolism by an AvrE family type III effector from Pantoea stewartii

Jo Ann E Asselin et al. Plant Physiol. 2015 Mar.

Abstract

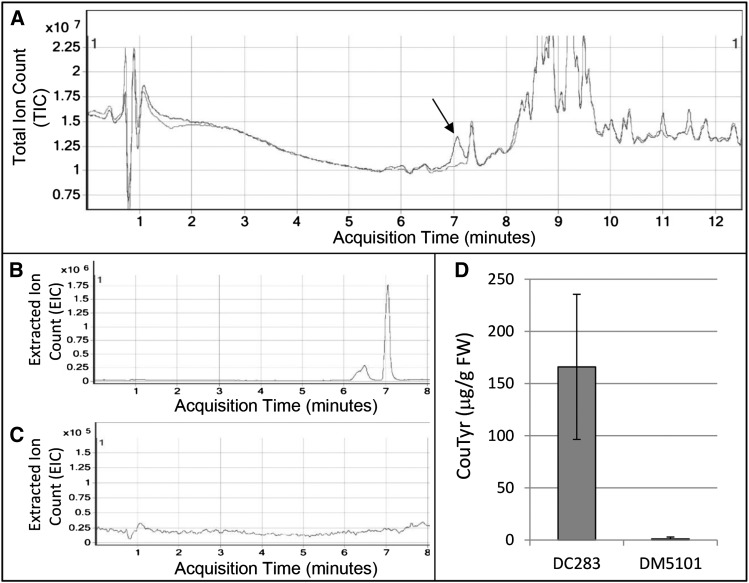
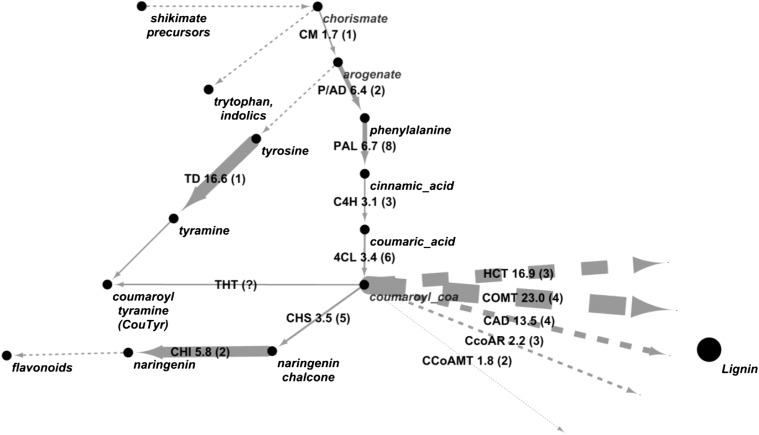
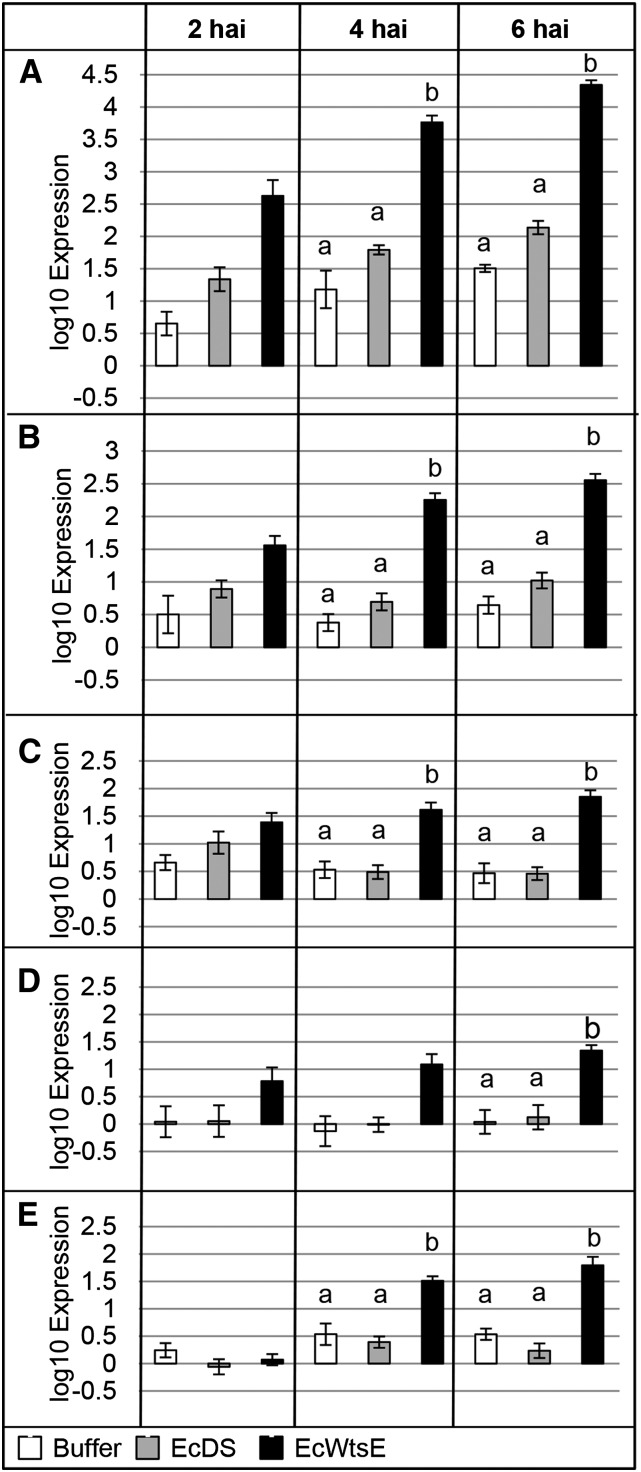
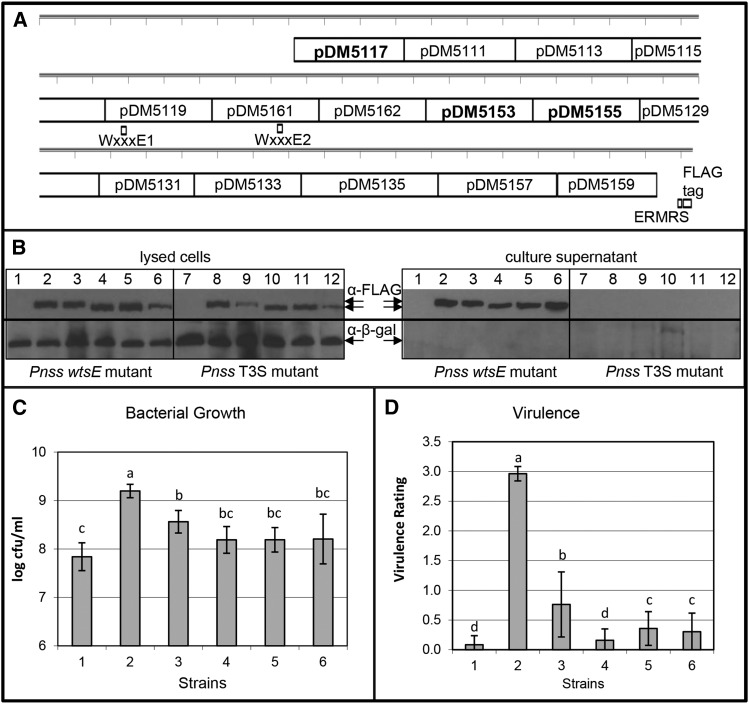
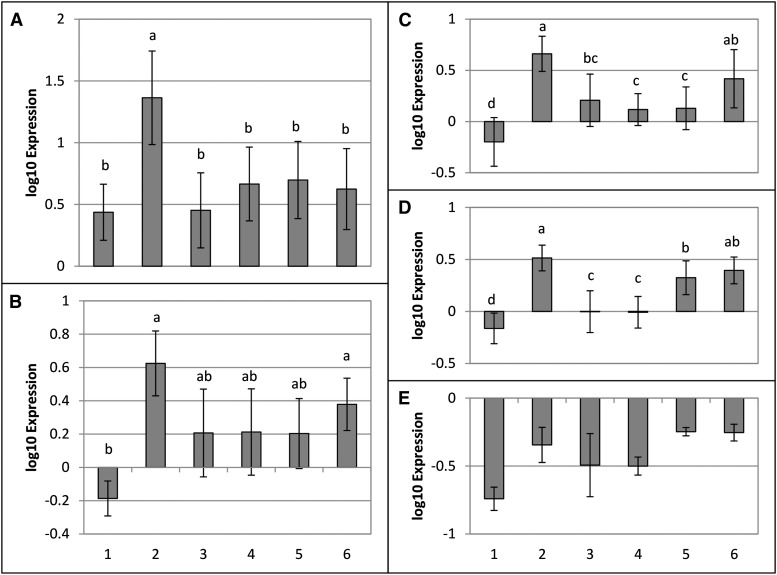
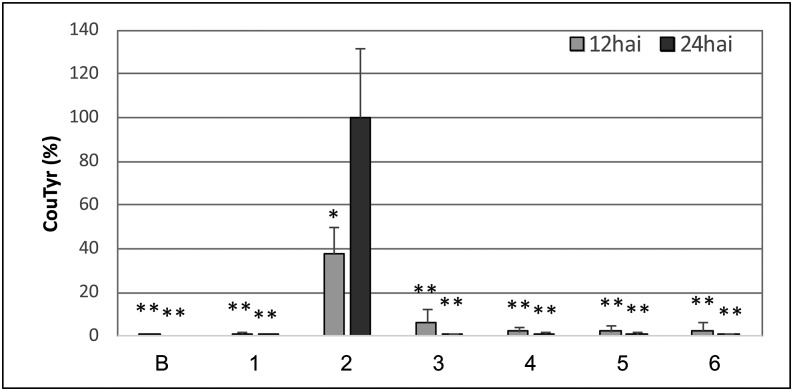
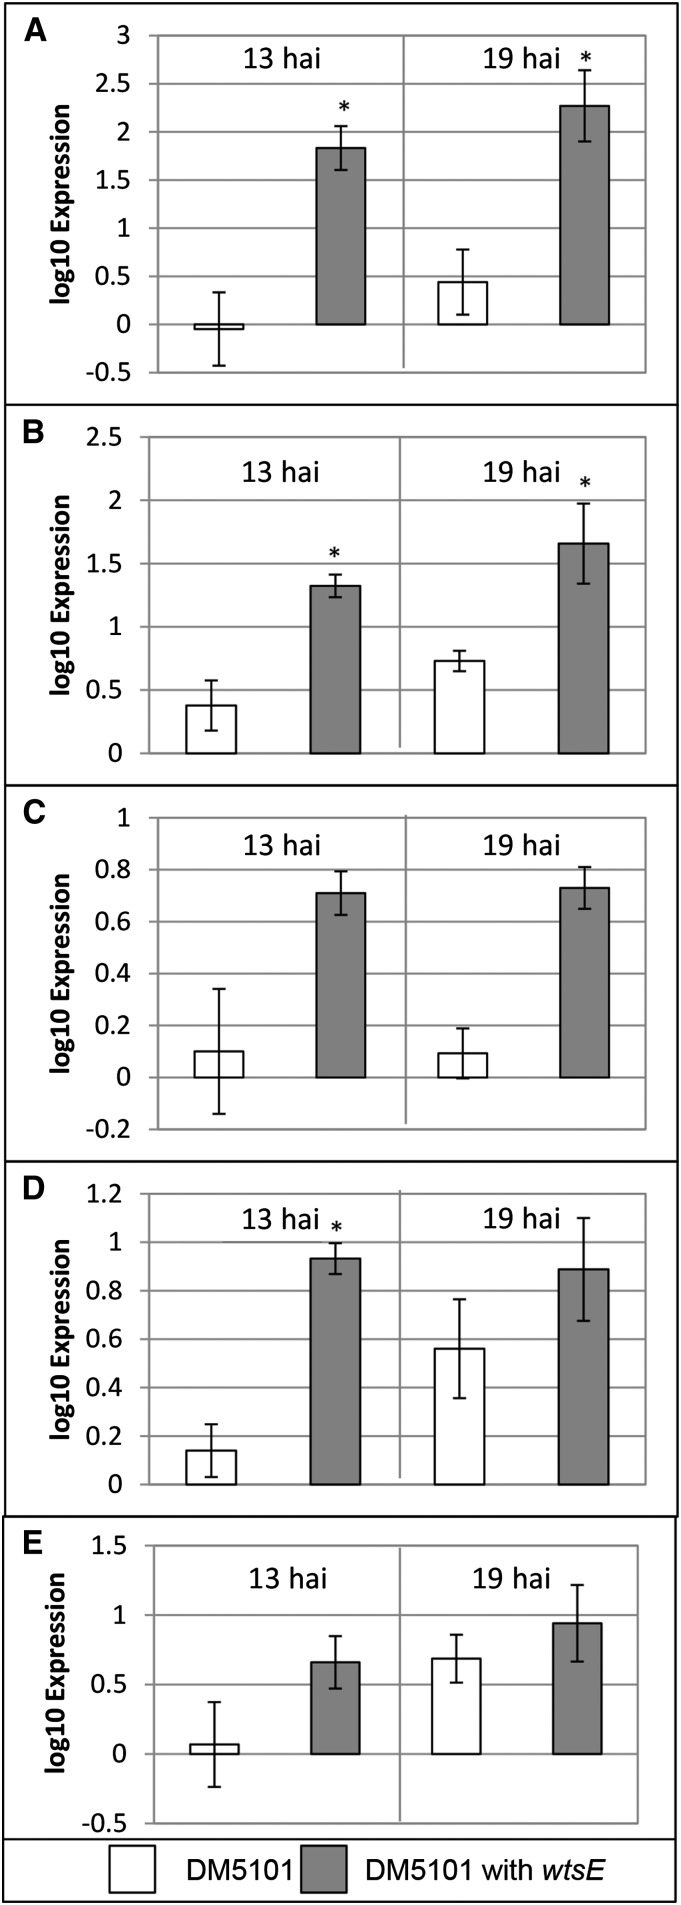
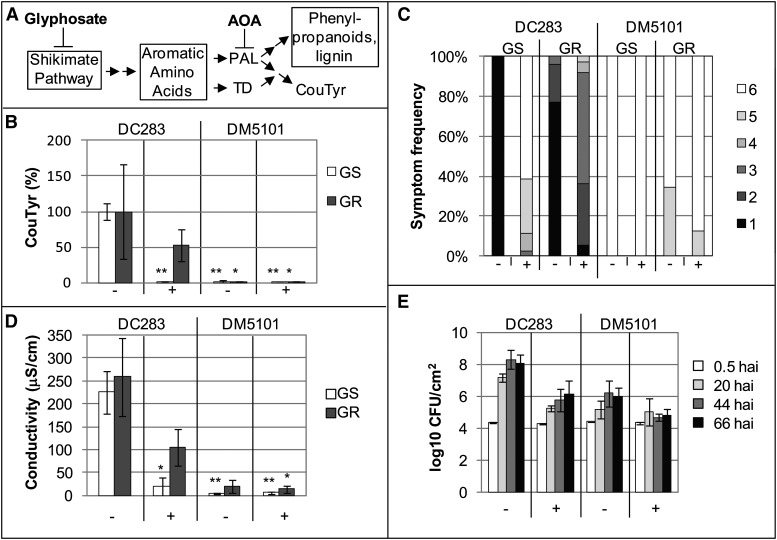
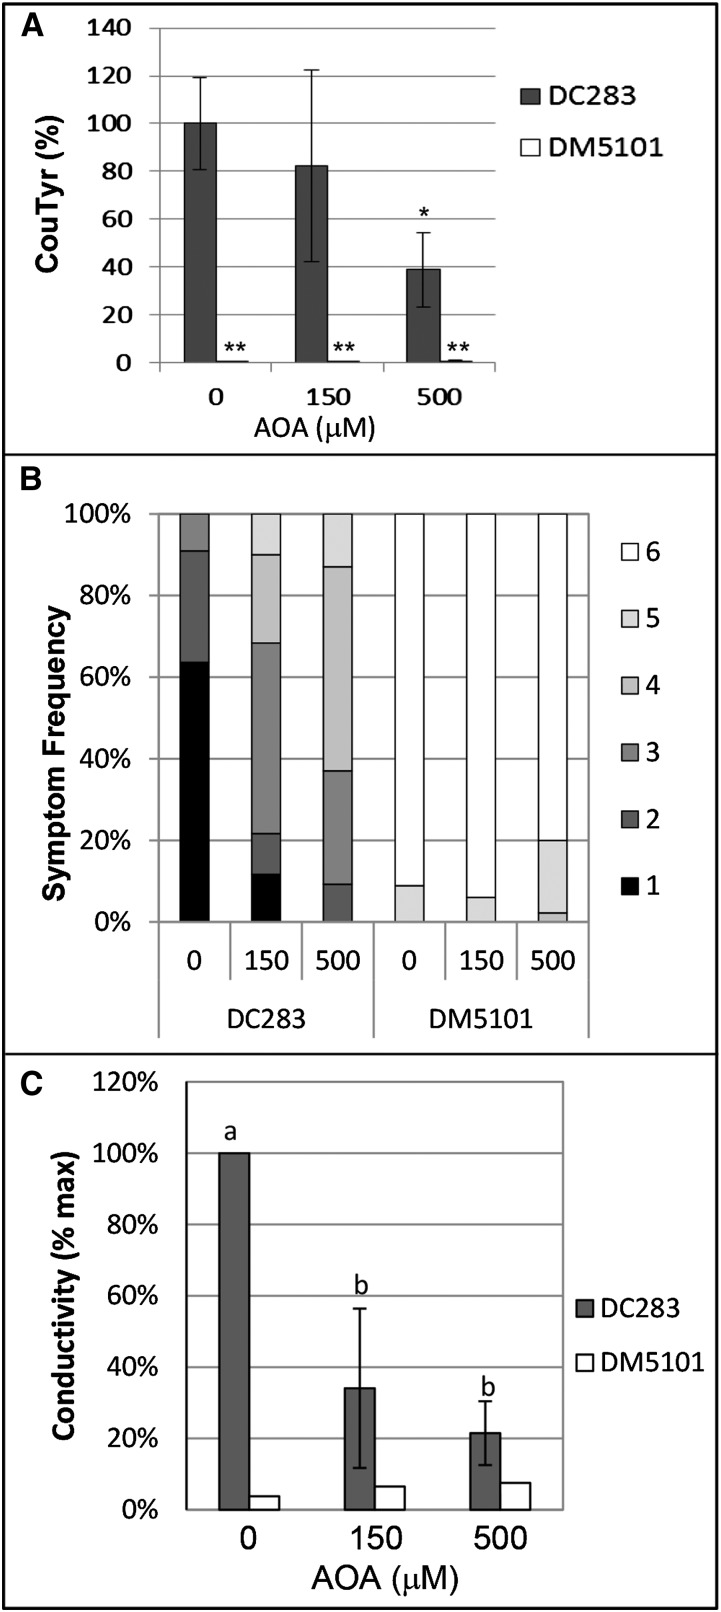
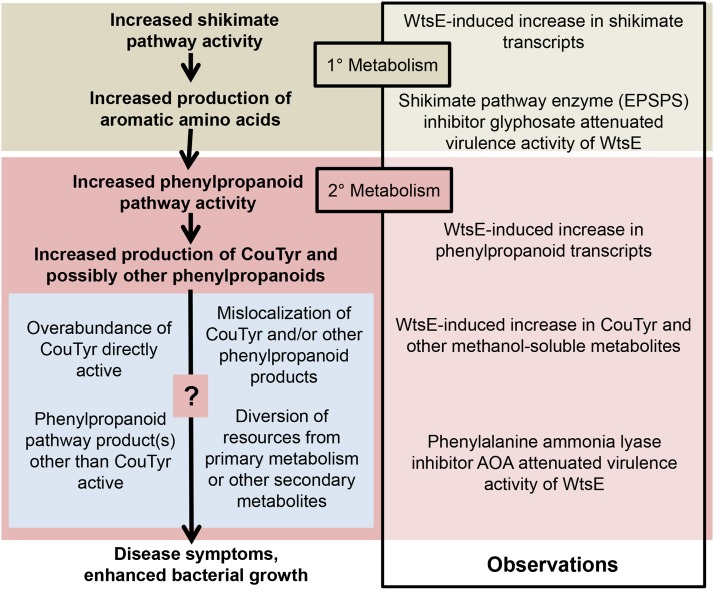
AvrE family type III effector proteins share the ability to suppress host defenses, induce disease-associated cell death, and promote bacterial growth. However, despite widespread contributions to numerous bacterial diseases in agriculturally important plants, the mode of action of these effectors remains largely unknown. WtsE is an AvrE family member required for the ability of Pantoea stewartii ssp. stewartii (Pnss) to proliferate efficiently and cause wilt and leaf blight symptoms in maize (Zea mays) plants. Notably, when WtsE is delivered by a heterologous system into the leaf cells of susceptible maize seedlings, it alone produces water-soaked disease symptoms reminiscent of those produced by Pnss. Thus, WtsE is a pathogenicity and virulence factor in maize, and an Escherichia coli heterologous delivery system can be used to study the activity of WtsE in isolation from other factors produced by Pnss. Transcriptional profiling of maize revealed the effects of WtsE, including induction of genes involved in secondary metabolism and suppression of genes involved in photosynthesis. Targeted metabolite quantification revealed that WtsE perturbs maize metabolism, including the induction of coumaroyl tyramine. The ability of mutant WtsE derivatives to elicit transcriptional and metabolic changes in susceptible maize seedlings correlated with their ability to promote disease. Furthermore, chemical inhibitors that block metabolic flux into the phenylpropanoid pathways targeted by WtsE also disrupted the pathogenicity and virulence activity of WtsE. While numerous metabolites produced downstream of the shikimate pathway are known to promote plant defense, our results indicate that misregulated induction of phenylpropanoid metabolism also can be used to promote pathogen virulence.


Figures

Figure 1.
Figure 1.
WtsE induces CouTyr accumulation in sweet maize ‘Seneca Horizon’ seedlings. A, Liquid chromatography-tandem mass spectrometry (LC-MS/MS) chromatograms showing overlaid total ion counts (TIC) of precursor mass ion scans (positive ion mode) of extracts of cv Seneca Horizon seedlings from 20 h after infiltration with wild-type Pnss (DC283; black trace) and the wtsE null mutant (DM5101; gray trace). WtsE-dependent accumulation of CouTyr is apparent at an acquisition time of approximately 7.1 min (arrow). B and C, Extracted ion counts (EIC) of putative CouTyr species (m/z = 284) in extracts from plants infiltrated with DC283 (B) or DM5101 (C) as in A. D, Quantification of CouTyr in extracts of plants treated as in A. Shown are combined data and sd from six biological replicates (n = 12). FW, Fresh weight.
Figure 2.
Figure 2.
Generalized pathway of secondary metabolism from chorismate to aromatic amino acids and their secondary products. Enzyme abbreviations are shown over the step(s) they catalyze; numbers next to enzyme names indicate the maximum observed fold increases in expression in WtsE-exposed versus control plants in microarray experiments. Arrow thickness relates to this fold-change value. Numbers in parentheses indicate how many genes were found up-regulated with P < 0.05. Dashed arrows indicate steps not shown. CAD, Cinnamoyl alcohol dehydrogenase; CCoAMT, caffeoyl-CoA O-methyltransferase; CcoAR, cinnamoyl-CoA reductase; CHI, chalcone isomerase; CHS, chalcone synthase; CM, chorismate mutase; COMT, caffeic acid O-methyltransferase; HCT, hydroxycinnamoyl transferase; THT, tyramine N-hydroxycinnamoyltransferase.
Figure 3.
Figure 3.
Expression of five genes associated with phenolic metabolism in maize seedlings vacuum infiltrated with buffer, EcDS, or EcWtsE. Tissue was recovered at 2, 4, and 6 hai, and expression was determined for TD (A), 4CL (B), C4H (C), P/AD (D), and PAL (E) transcripts. Plants exposed to WtsE had greater mRNA accumulation of each of these genes than controls. Shown are average values and se of six qRT-PCRs (three reactions each for the complementary DNA from two biological replicates). Each biological replicate consisted of the first true leaves from two seedlings. Significantly different expression levels for a given gene and time point are indicated with letters (ANOVA and Fisher’s lsd, P < 0.05). No values at 2 hai, nor the 4-hai time point for P/AD, were found to significantly differ from controls.
Figure 4.
Figure 4.
Pnss strains harboring mutated forms of wtsE were reduced in growth and virulence in maize seedlings. A, Map of WtsE showing the locations of the internal deletions in the listed plasmids and derivatives used for further analyses in boldface. Each tick represents 100 bp. B, Production and secretion of WtsE-FLAG and derivatives. Plasmid pJA017 encodes C terminally FLAG-tagged WtsE and the chaperone WtsF in vector pRK415. Pnss strains DM5101 (wtsE mutant) and DM711 (hrpJ type III secretion mutant) were transformed with pRK415, pJA017, or variants of pJA017 expressing wtsE derivatives. Proteins were visualized by anti-FLAG and anti-β-galactosidase (β-gal) immunoblotting from lysed cells (left) or from culture medium (right). Positions of WtsE derivatives and β-galactosidase, a cytoplasmic protein that serves as a loading control for cell lysis and a negative control for leakage of cell contents into the culture supernatant, are indicated by arrows. DM5101 (lanes 1–6) and DM711 (lanes 7–12) contained the following plasmids: lanes 1 and 7, pRK415; lanes 2 and 8, pJA017; lanes 3 and 9, pJA052 (wtsE w12 mutant, W694A, and W840A); lanes 4 and 10, pDM5117; lanes 5 and 11, pDM5153; and lanes 6 and 12, pDM5155. C and D, Average values and sd from three biological replicates measuring bacterial growth (C) and virulence (D) of DM5101 carrying the same plasmids as for lanes 1 to 6 in B. Both measurements were made 3 d after whorl inoculation with virulence rated on a scale from 0 to 3, with 3 being the most severe and 0 being symptomless. Different letters in C indicate significant differences in bacterial growth (ANOVA and Tukey’s honestly significant difference, P < 0.05). Different letters in D indicate significant differences in virulence (Kruskal-Wallis and Tukey’s mean rank tests, P < 0.05).
Figure 5.
Figure 5.
Effects of wild-type and mutated forms of WtsE on the expression of five genes associated with phenolic metabolism in maize seedlings. Six-day-old cv Seneca Horizon seedlings were vacuum infiltrated with EcDS (pRK415; 1), EcWtsE-FLAG (pJA017; 2), or the EcDS-expressing mutated forms of FLAG-tagged wtsE: w12 mutant (pJA052; 3), wtsEΔ709-1017 (pDM5109; 4), wtsEΔ2935-3234 (pDM5153; 5), or wtsEΔ3235-3534 (pDM5155; 6). Samples were collected at 4 hai, and the expression of TD (A), 4CL (B), C4H (C), P/AD (D), and PAL (E) was assessed. Shown are average values and se of qRT-PCRs done in triplicate for each of three biological replicates. Each biological replicate is two pooled first true leaves. Significantly different expression levels for a given gene and time point are indicated with letters (ANOVA and Fisher’s lsd, P < 0.05). For PAL, gene expression did not differ significantly among these treatments.
Figure 6.
Figure 6.
Effects of wild-type and mutated forms of WtsE on the accumulation of CouTyr. B73 maize seedlings were infiltrated with buffer (B) or with the EcDS carrying empty vector (pLAFR3; 1) or plasmids encoding wild-type wtsE (pJA001; 2), w12 mutant (pDM5175; 3), wtsEΔ709-1017 (pDM5189; 4), wtsEΔ2935-3234 (pDM5184; 5), or wtsEΔ3235-3534 (pDM5182; 6). Samples were collected at 12 and 24 hai, and the accumulation of CouTyr was measured by LC-MS/MS. Data, from two samples each from three independent biological replicates (n = 6), are presented as percentages of CouTyr induced by EcDS carrying wild-type wtsE (pJA001) ± sd. Asterisks indicate statistically significant differences in CouTyr levels compared with pJA001, as determined by two-tailed Student’s t test (*P < 0.01, **P < 0.001).
Figure 7.
Figure 7.
Expression of five genes associated with phenolic metabolism in maize seedlings following infiltration with a Pnss wtsE null mutant and a complemented strain. Tissue from cv Seneca Horizon seedlings was harvested at 13 and 19 hai with a wtsE null mutant of Pnss (DM5101) carrying empty vector (pRK415; white bars) or plasmid-borne wtsE (pJA017; gray bars), and the accumulation of TD (A), 4CL (B), C4H (C), P/AD (D), and PAL (E) transcripts was assessed by quantitative PCR. Shown are average values and se of qRT-PCRs done in triplicate for each of three biological replicates. Asterisks indicate significantly different expression levels relative to the infiltration of DM5101 for a given gene at a single time point (two-tailed Student’s t test, P < 0.05).
Figure 8.
Figure 8.
Inhibition of the shikimate pathway attenuates the virulence activity of WtsE. A, Schematic showing the point of action of glyphosate (and AOA). Boxes contain multiple enzymatic steps and/or processes. B to D, Glyphosate-susceptible cv Seneca Horizon (GS) or glyphosate-resistant Pioneer P1615XR (GR) maize seedlings were sprayed with buffer (−) or 0.5% (w/v) glyphosate (+). Six hours later, plants were infiltrated with wild-type Pnss strain DC283 or wtsE mutant strain DM5101. At 20 hai, assessments were made of CouTyr accumulation (B), symptom severity (C), and ion leakage (D). B, CouTyr level was measured in two samples each from three independent biological replicates (n = 6) by LC-MS/MS. Data are presented as percentages of the appropriate varietal treatment with DC283 in the absence of glyphosate ± sd. Asterisks indicate statistically significant differences in CouTyr levels compared with the DC283 treatment in the same variety and in the absence of glyphosate, as determined by two-tailed Student’s t tests (*P < 0.05 and **P < 0.001). C, Symptom development of inoculated plants was assessed on a scale from 1 to 6, with 1 representing plants with very severe symptoms, and 6 representing nonsymptomatic plants. Shown are combined data from three biological replicates composed of 30 or more observations per combination. D, Average values and sd from three biological replicates for cv Seneca Horizon and two biological replicates for Pioneer P1615XR. Asterisks indicate statistically significant differences compared with DC283 without glyphosate as determined by two-tailed Student’s t tests (*P < 0.05 and **P < 0.001). E, Plants of cv Seneca Horizon sprayed 6 h earlier with buffer (−) or 0.5% (w/v) glyphosate (+) were infiltrated with a low titer of DC283 or DM5101, and bacterial growth was measured over the following 66 h. Shown are average values and sd of pooled data from three independent biological replicates.
Figure 9.
Figure 9.
Inhibition of PAL attenuates the virulence activity of WtsE. Six-day-old maize seedlings were inoculated with DC283 or DM5101 along with no AOA (0) or the indicated concentrations of AOA (150 or 500 μm). A, CouTyr level was measured at 20 hai in two samples each from three independent biological replicates (n = 6) by LC-MS/MS. Within each biological replicate, the level of CouTyr induced by DC283 with no AOA was set to 100%. Error bars indicate sd, and asterisks indicate statistically significant differences in CouTyr levels compared with DC283 with no AOA (two-tailed Student’s t test, *P < 0.01 and **P < 0.001). B and C, Disease symptoms (B) and ion leakage (C) were assessed at 20 hai as in Figure 8, C and D. B, Combined data from three biological replicates composed of 45 or more observations per combination. C, Average values and sd of 10 technical replicates from three independent biological replicates, with letters indicating significant differences in CouTyr accumulation between DC283 treatments (ANOVA and Tukey’s honestly significant difference, P < 0.05).
Figure 10.
Figure 10.
Model. WtsE induces phenylpropanoid metabolism to cause disease symptoms and promote bacterial growth in maize leaves. Observations made in this study are listed in the box to the right. Inferences consistent with these observations are listed in boldface type. Suggested modes of action of phenylpropanoid pathway products are listed in the blue box.

References

    1. Ahmad M, Majerczak DR, Pike S, Hoyos ME, Novacky A, Coplin DL (2001) Biological activity of harpin produced by Pantoea stewartii subsp. stewartii. Mol Plant Microbe Interact 14: 1223–1234 - PubMed
    1. Ahmad S, Veyrat N, Gordon-Weeks R, Zhang Y, Martin J, Smart L, Glauser G, Erb M, Flors V, Frey M, et al. (2011) Benzoxazinoid metabolites regulate innate immunity against aphids and fungi in maize. Plant Physiol 157: 317–327 - PMC - PubMed
    1. Ahuja I, Kissen R, Bones AM (2012) Phytoalexins in defense against pathogens. Trends Plant Sci 17: 73–90 - PubMed
    1. Alto NM, Shao F, Lazar CS, Brost RL, Chua G, Mattoo S, McMahon SA, Ghosh P, Hughes TR, Boone C, et al. (2006) Identification of a bacterial type III effector family with G protein mimicry functions. Cell 124: 133–145 - PubMed
    1. Ausubel FM, Brent R, Kingston RE, More DD, Seidman JG, Smith JA, Struhl K (1997) Short Protocols in Molecular Biology: A Compendium of Methods from Current Protocols in Molecular Biology, Ed 3.John Wiley & Sons, New York

Publication types

MeSH terms

LinkOut - more resources