. 2015 Jul;26(7):1619-33.
doi: 10.1681/ASN.2014050518. Epub 2015 Jan 29.

A Salt-Induced Reno-Cerebral Reflex Activates Renin-Angiotensin Systems and Promotes CKD Progression

Affiliations

A Salt-Induced Reno-Cerebral Reflex Activates Renin-Angiotensin Systems and Promotes CKD Progression

Wei Cao et al. J Am Soc Nephrol. 2015 Jul.

Abstract

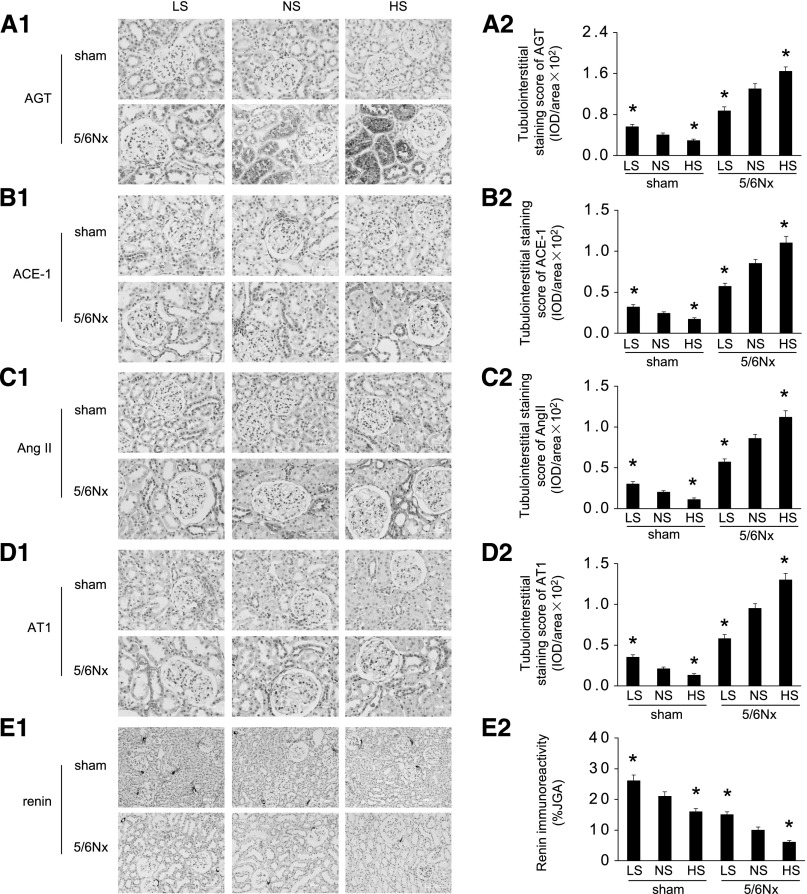
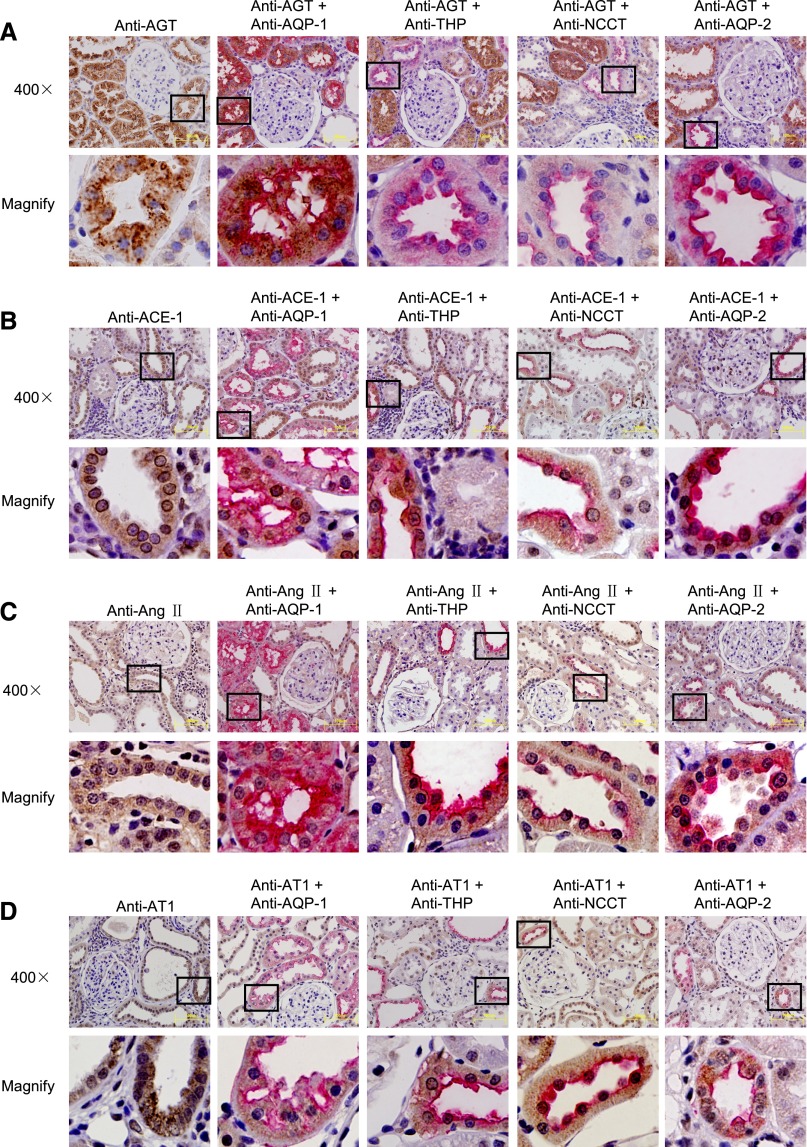
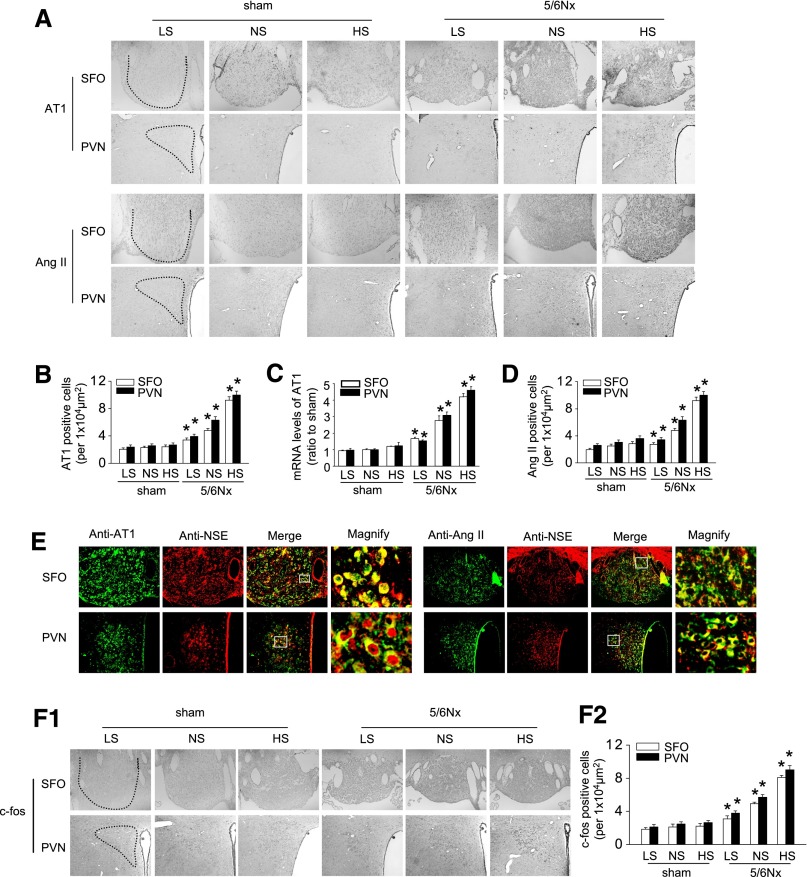
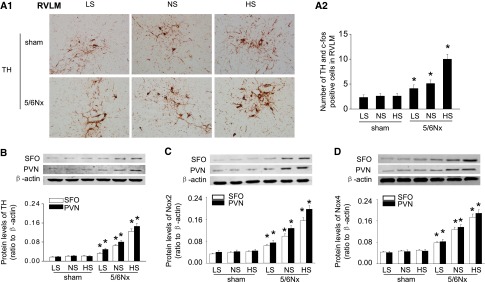
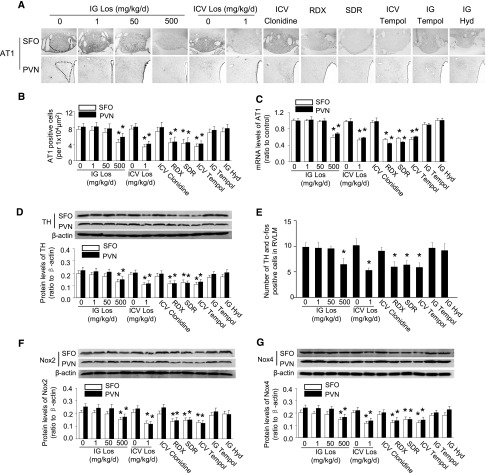
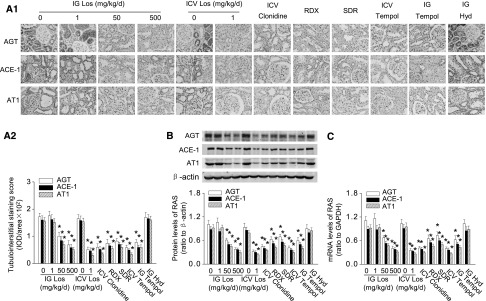
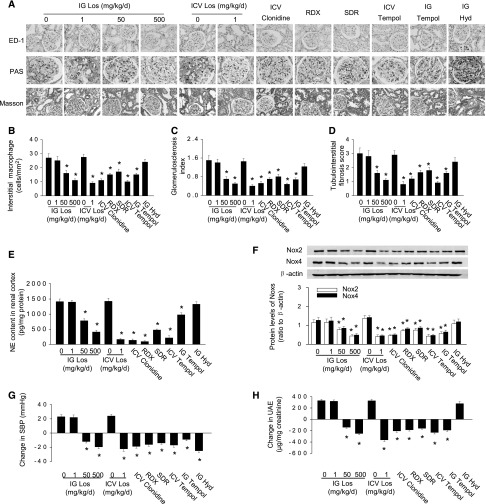
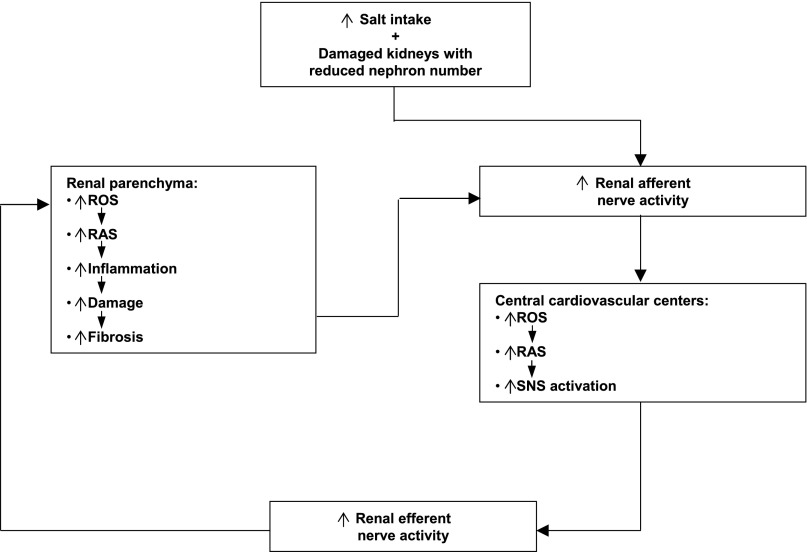
Salt intake promotes progression of CKD by uncertain mechanisms. We hypothesized that a salt-induced reno-cerebral reflex activates a renin-angiotensin axis to promote CKD. Sham-operated and 5/6-nephrectomized rats received a normal-salt (0.4%), low-salt (0.02%), or high-salt (4%) diet for 2 weeks. High salt in 5/6-nephrectomized rats increased renal NADPH oxidase, inflammation, BP, and albuminuria. Furthermore, high salt activated the intrarenal and cerebral, but not the systemic, renin-angiotensin axes and increased the activity of renal sympathetic nerves and neurons in the forebrain of these rats. Renal fibrosis was increased 2.2-fold by high versus low salt, but intracerebroventricular tempol, losartan, or clonidine reduced this fibrosis by 65%, 69%, or 59%, respectively, and renal denervation or deafferentation reduced this fibrosis by 43% or 38%, respectively (all P<0.05). Salt-induced fibrosis persisted after normalization of BP with hydralazine. These data suggest that the renal and cerebral renin-angiotensin axes are interlinked by a reno-cerebral reflex that is activated by salt and promotes oxidative stress, fibrosis, and progression of CKD independent of BP.

Keywords: brain; kidney; renal fibrosis; renin-angiotensin system; salt.


Figures

Figure 1.
Figure 1.
High salt induces renal inflammation, fibrosis, sympathetic activation, and oxidative stress in 5/6Nx rats. (A) Representative photographs of macrophage (ED-1–positive cells) infiltration and renal fibrosis (shown by PAS or Masson staining). (B–D) Quantitative analysis of macrophage infiltration (B), glomerulosclerosis index (C), and tubulointerstitial fibrosis score (D). (E) Changes in SBP. (F) Changes in UAE. (G) Concentration of NE in renal cortex. (H–I) Protein (H) and mRNA (I) levels of Noxs in renal cortex. Data from three independent experiments are expressed as the mean±SD (n=6 in each group). *P<0.05 versus normal salt in the respective group. HS, high salt; LS, low salt; NS, normal salt; PAS, periodic acid–Schiff.
Figure 2.
Figure 2.
High salt induces paradoxical activation of intrarenal RAS in 5/6Nx rats. (A) Expression of AGT: representative photographs of AGT expression (A1) and semiquantitative data of AGT expression (A2). (B) Expression of ACE-1: representative photographs of ACE-1 expression (B1) and semiquantitative data of ACE-1 expression (B2). (C) Expression of AngII: representative photographs of AngII expression (C1) and semiquantitative data of AngII expression (C2). (D) Expression of AT1 receptors: representative photographs of AT1 receptor expression (D1) and semiquantitative data of AT1 receptor expression (D2). (E) Expression of renin: representative photographs of renin expression (E1) and semiquantitative data of renin expression (E2). The semiquantitative data are expressed as the mean±SD of three independent experiments (n=6 in each group). *P<0.05 versus normal salt in the respective group. HS, high salt; LS, low salt; NS, normal salt.
Figure 3.
Figure 3.
High-salt–induced renal RAS expression is mainly localized in tubular cells. (A) Representative photographs of AGT localization determined with double staining of antibodies against AGT and markers of renal tubular segments. (B) Location of ACE-1 determined with double staining of antibodies against ACE-1 and markers of renal tubular segments. (C) Location of AngII determined with double staining of antibodies against AngII and markers of renal tubular segments. (D) Location of AT1 receptors determined with double staining of antibodies against AT1 receptors and markers of renal tubular segments. AQP-1, aquaporin 1 (proximal tubule); AQP-2, aquaporin 2 (collecting duct); NCCT, thiazide-sensitive NaCl cotransporter (distal tubule); THP, Tamm–Horsfall protein (thick ascending limb).
Figure 4.
Figure 4.
High salt activates central neurons to express RAS in 5/6Nx rats. (A) Representative photographs of immunohistochemistry staining of AT1 receptors and AngII in SFO and PVN. (B) Semiquantitative data of AT1 receptors. (C) Expression of AT1 receptor mRNA measured by real-time PCR. (D) Semiquantitative data of AngII. (E) Localization of central AT1 receptors or AngII determined by double staining with the antibodies against AT1 receptors or AngII (green) and the antibody-recognized NSE (red). (F) Expression of c-fos in SFO and PVN: representative photographs of immunohistochemistry staining (F1) and semiquantitative data (F2). Data are expressed as the mean±SD of three independent experiments (n=6 in each group). *P<0.05 versus sham group fed with the same salt diet. HS, high salt; LS, low salt; NS, normal salt; NSE, neuron-specific enolase.
Figure 5.
Figure 5.
High salt intake upregulates expression of central TH and Noxs in 5/6Nx rats. (A) The number of c-fos–positive and TH-expressing neurons in RVLM, detected by double labeling of TH (brown cytoplasmic) and c-fos (red nuclear), markedly increases in high-salt–fed 5/6Nx rats: representative photographs (A1) and quantitative data (A2). (B) Expression of TH levels in SFO and PVN assessed by Western blot. (C and D) Expression of Nox2 (C) and Nox4 (D) analyzed by Western blot. Data are expressed as the mean±SD of three independent experiments (n=6 in each group). *P<0.05 versus sham group fed with the same salt diet. HS, high salt; LS, low salt; NS, normal salt.
Figure 6.
Figure 6.
Blockade of central RAS or oxidative stress inhibits salt-induced neuron activation and TH expression in 5/6Nx rats. (A–C) Central administration of losartan or tempol and RDX or SDR downregulate expression of central AT1 receptors: representative photographs of immunohistochemistry staining (A), semiquantitative data (B), and AT1 receptor mRNA level assessed by real-time PCR (C). (D and E) Central administration of losartan or tempol and RDX or SDR downregulate TH expression in SFO and PVN (D) as well as in RVLM (E). (F and G) Central administration of losartan or tempol and RDX or SDR reduce overexpression of Nox2 (F) and Nox4 (G) in brain. Data are expressed as the mean±SD of three independent experiments (n=6 in each group). *P<0.05 versus 5/6Nx rats given vehicle (0 mg/kg per day of inhibitor). Hyd, hydralazine; Los, losartan; RDX, renal denervation; SDR, selective dorsal rhizotomy.
Figure 7.
Figure 7.
Blockade of central RAS, sympathetic signal, or oxidative stress inhibits salt-induced renal RAS activation in 5/6Nx rats. (A) Central administration of losartan or tempol and RDX or SDR downregulate overexpression of renal RAS in high-salt–fed 5/6Nx rats: representative photographs (A1) and semiquantitative analysis (A2). (B) Protein expression of intrarenal RAS in renal cortex homogenates. (C) Expression of RAS mRNA in renal cortex homogenates detected by real-time PCR. Data are expressed as the mean±SD of three independent experiments (n=6 in each group). *P<0.05 versus 5/6Nx rats given vehicle. Hyd, hydralazine; Los, losartan; RDX, renal denervation; SDR, selective dorsal rhizotomy.
Figure 8.
Figure 8.
Blockade of central RAS, sympathetic signal, or oxidative stress inhibits salt-induced renal inflammation, fibrosis, and dysfunction in 5/6Nx rats. (A–D) Central administration of losartan or tempol and RDX or SDR inhibit salt-induced renal inflammation, fibrosis, and dysfunction in 5/6Nx rats: representative photographs of macrophage infiltration and renal fibrosis (A), quantitative analysis of renal macrophage infiltration (B), glomerulosclerosis index (C), and tubulointerstitial fibrosis score (D). (E) Concentration of NE in renal cortex. (F) Protein expression of Noxs in renal cortex. (G) Changes in SBP. (H) Changes in UAE. Data are expressed as the mean±SD of three independent experiments (n=6 in each group). *P<0.05 versus 5/6Nx rats given vehicle. Hyd, hydralazine; Los, losartan; PAS, periodic acid–Schiff; RDX, renal denervation; SDR, selective dorsal rhizotomy.
Figure 9.
Figure 9.
Schematic diagram summarizing coactivation by salt intake of oxidative stress and RAS in the damaged kidney and brain linked via the afferent and efferent renal sympathetic nerves in a positive feedback mode.

References

    1. Zeisberg M, Neilson EG: Mechanisms of tubulointerstitial fibrosis. J Am Soc Nephrol 21: 1819–1834, 2010 - PubMed
    1. Nangaku M: Mechanisms of tubulointerstitial injury in the kidney: Final common pathways to end-stage renal failure. Intern Med 43: 9–17, 2004 - PubMed
    1. Wynn TA: Fibrotic disease and the T(H)1/T(H)2 paradigm. Nat Rev Immunol 4: 583–594, 2004 - PMC - PubMed
    1. Eddy AA, Neilson EG: Chronic kidney disease progression. J Am Soc Nephrol 17: 2964–2966, 2006 - PubMed
    1. Speed JS, Pollock DM: Endothelin, kidney disease, and hypertension. Hypertension 61: 1142–1145, 2013 - PMC - PubMed

Publication types

MeSH terms