. 2014 Sep 30:5:259.
doi: 10.4172/2155-9899.1000259.

Tyrosine Kinase Inhibition Regulates Early Systemic Immune Changes and Modulates the Neuroimmune Response in α-Synucleinopathy

Affiliations

Tyrosine Kinase Inhibition Regulates Early Systemic Immune Changes and Modulates the Neuroimmune Response in α-Synucleinopathy

Michaeline L Hebron et al. J Clin Cell Immunol. .

Abstract

Objectives: Neuro-inflammation is common in α-Synucleinopathies and Tauopathies; and evidence suggests a link between the tyrosine kinase Abl and neurodegeneration. Abl upregulates α-Synuclein and promotes Tau hyper-phosphorylation (p-Tau), while Abl inhibitors facilitate autophagic clearance.

Methods: A model of α-Synucleinopathy harboring human mutant A53T α-Synuclein and exhibits concomitant increase in murine p-Tau was used to determine the immunological response to Abl inhibition.

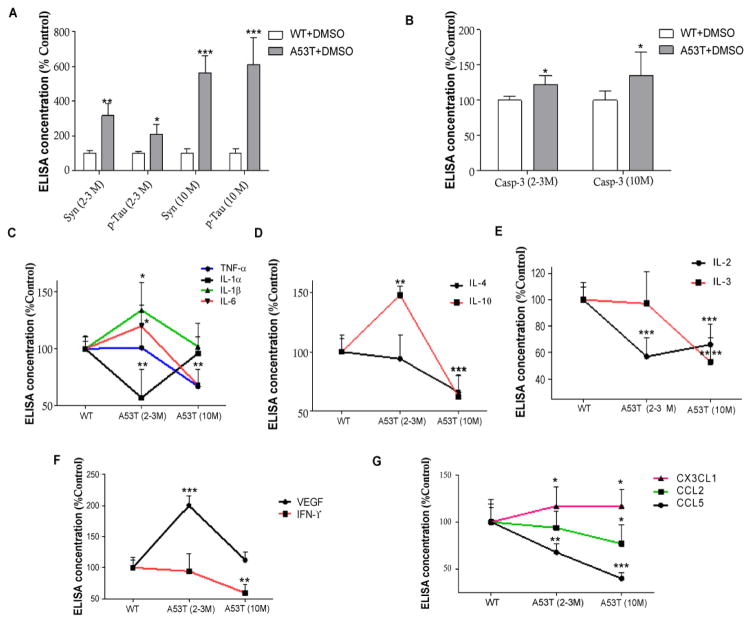
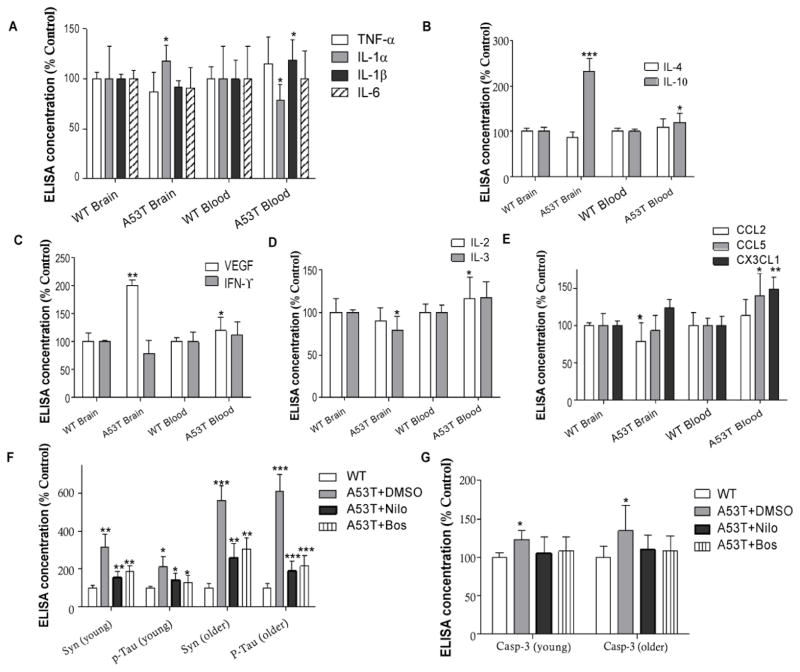
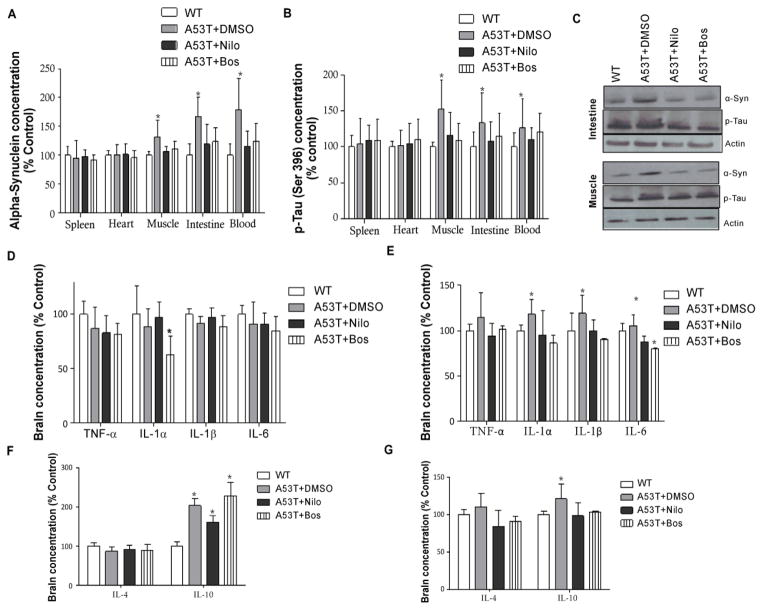
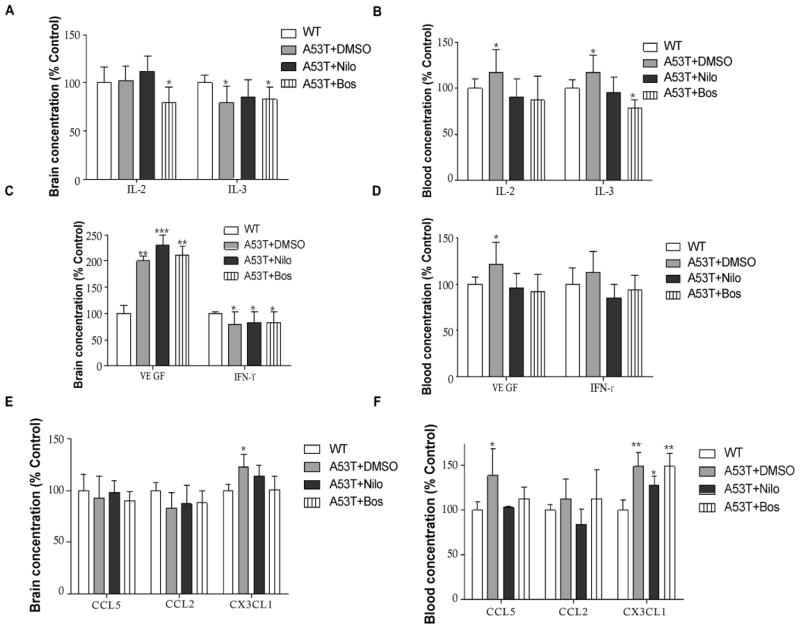
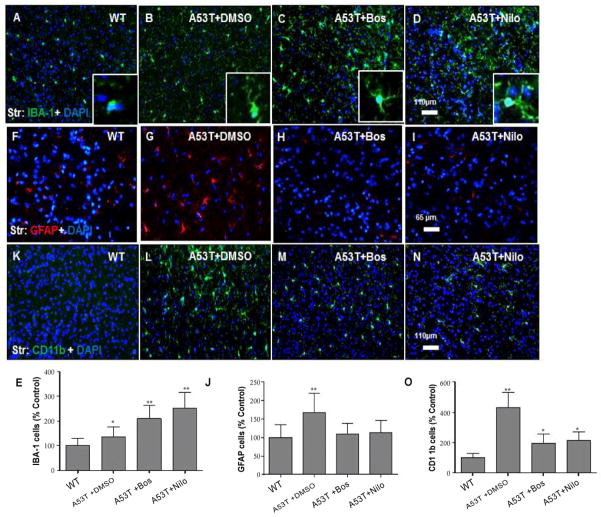
Results: Age-dependent alterations of brain immunity, including loss of IL-10 and decreased levels of IL-2 and IL-3 were observed in old A53T mice. Brain CCL2 and CCL5 were decreased, but CX3CL1 remained constantly elevated. Young A53T mice exhibited differential systemic and central immune profiles in parallel with increased blood markers of adaptive immunity, suggesting an early systemic immune response. Tyrosine kinase inhibitors (TKIs), including nilotinib and bosutinib reduced brain and peripheral α-Synuclein and p-Tau and modulated blood immunological responses. TKIs did not affect brain IL-10, but they changed the levels of all measured blood immune markers, except CX3CL1. TKIs altered microglia morphology and reduced the number of astrocyte and dendritic cells, suggesting beneficial regulation of microglia.

Conclusions: These data indicate that tyrosine kinase inhibition affects neuro-inflammation via early changes of the peripheral immune profile, leading to modulation of the neuro-immune response to α-Synuclein and p-Tau.

Keywords: Abl; Bosutinib; Inflammation; Microglia; Nilotinib; Tau; α-Synuclein.


Conflict of interest statement

Conflict of Interest

Dr. Charbel Moussa has a provisional patent application to use nilotinib and bosutinib to treat neurodegenerative diseases. Other authors declare no conflict of interest in association with this manuscript.

Figures

Figure 1
Figure 1. Age-dependent alterations of brain immunity in A53T mice
Histograms represent ELISA levels of A) α-Synuclein and p-Tau in the brain of A53T mice, and B) shows caspase-3 activity in young and older mice. Graphs represent the levels of mouse A53T brain immune markers, including C) pro-inflammatory IL-1α, IL-1β, IL-6 and TNF-α, D) anti-inflammatory IL-4 and IL-10, E) modulators of immune memory IL-2 and IL3, F) VEGF and IFN-γ and G) chemokines CCL2, CCL5 and CX3CL1. n= 5 for each strain at each time point. ANOVA, Neuman Keuls, Mean±SD, * indicates significantly different than WT with p<0.05, **p<0.01, ***p<0.001, **** p<0.0001.
Figure 2
Figure 2. Differential levels of immune markers in A53T brain and blood
Histograms represent levels of A) pro-inflammatory cytokines IL-1α, IL-1β, IL-6 and TNF-α in the brain and total blood of A53T mice, B) anti-inflammatory cytokines IL-4 and IL-10, C) modulators of immune memory IL-2 and IL3, D) VEGF and IFN-γ and E) chemokines CCL2, CCL5 and CX3CL1. n=4 for each strain at each time point. ANOVA, Neuman Keuls, Mean±SD, * indicates significantly different than WT with p<0.05, **p<0.01, ***p<0.001. Histograms represent ELISA levels of F) α-Synuclein and p-Tau and G) caspase-3 activity in the brain of A53T mice treated I.P with 10 mg/kg nilotinib or 5 mg/kg bosutinib or 3 μL DMSO every other day for 6 weeks. n=4 for each strain at each time point. ANOVA, Neuman Keuls, Mean±SD, * indicates significantly different than WT with p<0.05, **p<0.01, ***p<0.001.
Figure 3
Figure 3. Nilotinib and bosutinib decrease CNS and peripheral levels of α-Synuclein and p-Tau and modulate cytokine levels
Histograms represent ELISA levels of A) α-Synuclein and B) p-Tau in the spleen, heart, muscle, intestine and blood of A53T mice treated I.P with 10 mg/kg nilotinib or 5 mg/kg bosutinib or 3 μL DMSO every other day for 6 weeks. C) Western blot analysis on 10% S NuPAGE gel showing analysis of muscle and intestine homogenized in 1xSTEN buffer to compare nilotinib and bosutinib effects with DMSO in A53T mice. D) brain and E) blood levels of pro-inflammatory IL-1α, IL-1β, IL-6 and TNF-α. F) brain and G) blood levels of anti-inflammatory IL-4 and IL-10. n= 5 for each strain at each time point. ANOVA, Neuman Keuls, Mean±SD, * indicates significantly different than W, p<0.05.
Figure 4
Figure 4. Nilotinib and bosutinib modulate changes in the blood immunological profiles of A53T mice
Histograms represent ELISA levels in A53T mice treated I.P with 10 mg/kg nilotinib or 5 mg/kg bosutinib or 3 μL DMSO every other day for 6 weeks in A) brain and B) blood levels of modulators of immune memory IL-2 and IL3, C) brain and D) blood VEGF and IFN-γ and E) and F) blood levels chemokines CCL2, CCL5 and CX3CL1. n=5 for each strain at each time point. ANOVA, Neuman Keuls, Mean±SD, * indicates significantly different than WT with p<0.05, **p<0.01.
Figure 5
Figure 5. Nilotinib and bosutinib alter microglia morphology and reduce the number of astrocyte and dendritic cells
Coronal 20 μm thick brain sections show IBA-1 and nuclear DAPI staining of microglia in the striatum of A) WT mice, B) A53T mice treated with DMSO, insert is higher magnification, C) A53T mice treated with bosutinib, insert is higher magnification, and D) A53T mice treated with nilotinib, insert is higher magnification. E) histograms represent stereological quantification. Coronal 20 μm thick brain sections show GFAP and nuclear DAPI staining of astrocytes in the striatum of F) WT mice, G) A53T mice treated with DMSO, H) A53T mice treated with bosutinib, and I) A53T mice treated with nilotinib. J) histograms represent stereological quantification. Dendritic cells stained with CD11b and nuclear DAPI labeling in the striatum of K) WT mice, L) A53T mice treated with DMSO, M) A53T mice treated with bosutinib, and N) A53T mice treated with nilotinib. O) histograms represent stereological quantification. n=5 for each strain at each time point. n=4, ANOVA, Neuman Keuls, Mean±SD, * indicates significantly different than WT with p<0.05, **p<0.01.

References

    1. Akiyama H, Barger S, Barnum S, Bradt B, Bauer J, et al. Inflammation and Alzheimer’s disease. Neurobiol Aging. 2000;21:383–421. - PMC - PubMed
    1. Roodveldt C, Christodoulou J, Dobson CM. Immunological features of alpha-synuclein in Parkinson’s disease. J Cell Mol Med. 2008;12:1820–1829. - PMC - PubMed
    1. Reynolds AD, Kadiu I, Garg SK, Glanzer JG, Nordgren T, et al. Nitrated alpha-synuclein and microglial neuroregulatory activities. J Neuroimmune Pharmacol. 2008;3:59–74. - PMC - PubMed
    1. Zhang W, Wang T, Pei Z, Miller DS, Wu X, et al. Aggregated alpha-synuclein activates microglia: a process leading to disease progression in Parkinson’s disease. FASEB J. 2005;19:533–542. - PubMed
    1. Reynolds AD, Banerjee R, Liu J, Gendelman HE, Mosley RL. Neuroprotective activities of CD4+CD25+ regulatory T cells in an animal model of Parkinson’s disease. J Leukoc Biol. 2007;82:1083–1094. - PubMed