. 2015 Jan 29;160(3):516-27.
doi: 10.1016/j.cell.2014.12.026.

Visualizing hypothalamic network dynamics for appetitive and consummatory behaviors

Affiliations

Visualizing hypothalamic network dynamics for appetitive and consummatory behaviors

Joshua H Jennings et al. Cell. .

Abstract

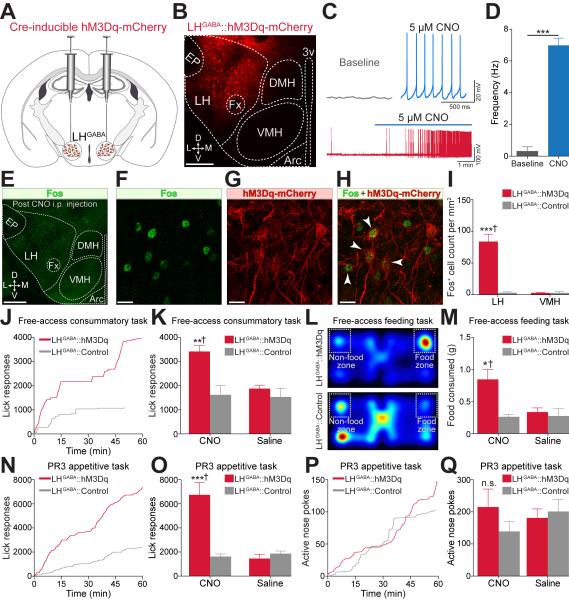
Optimally orchestrating complex behavioral states, such as the pursuit and consumption of food, is critical for an organism's survival. The lateral hypothalamus (LH) is a neuroanatomical region essential for appetitive and consummatory behaviors, but whether individual neurons within the LH differentially contribute to these interconnected processes is unknown. Here, we show that selective optogenetic stimulation of a molecularly defined subset of LH GABAergic (Vgat-expressing) neurons enhances both appetitive and consummatory behaviors, whereas genetic ablation of these neurons reduced these phenotypes. Furthermore, this targeted LH subpopulation is distinct from cells containing the feeding-related neuropeptides, melanin-concentrating hormone (MCH), and orexin (Orx). Employing in vivo calcium imaging in freely behaving mice to record activity dynamics from hundreds of cells, we identified individual LH GABAergic neurons that preferentially encode aspects of either appetitive or consummatory behaviors, but rarely both. These tightly regulated, yet highly intertwined, behavioral processes are thus dissociable at the cellular level.


Figures

Figure 1
Figure 1. Optogenetic Modulation of LH GABAergic Neurons Bidirectionally Modulates Feeding and Reward-Related Behaviors
(A) Scheme for viral targeting of AAV5-EF1α-DIO-ChR2-eYFP to the LH of Vgat-IRES-Cre animals. (B) 20x confocal image depicting ChR2-eYFP expression in LH GABAergic neurons. EP: entopeduncular nucleus, LH: lateral hypothalamus, Fx: fornix, DMH: dorsomedial hypothalamic nucleus, VMH: ventromedial hypothalamic nucleus, Arc: arcuate nucleus, 3v: third ventricle, D: dorsal, L: lateral, M: medial, V: ventral. Scale bar, 200 µm. (C) Diagram for photostimulation of LH GABAergic neurons. (D) Color map encoding spatial location from an ad lib fed LHGABA::ChR2 mouse during the free-access feeding paradigm. (E) Photostimulation of LH GABAergic neurons significantly increased time spent in the food zone compared to controls and time epochs without photostimulation (n = 5 mice per group, F2,27 = 86.24, p < 0.0001). (F) 20-Hz photostimulation significantly increased food intake in LHGABA::ChR2 mice compared to controls and time epochs without photostimulation (n = 5 mice per group, F2,27 = 17.05, p < 0.0001). (G) LHGABA::ChR2 mice spent significantly more time in the chamber paired with photostimulation compared to controls (n = 5 mice per group, t8 = 6.796, p < 0.0001). (H) LHGABA::ChR2 mice nose poked significantly more for 20-Hz photostimulation compared to controls (n = 4 mice per group, t5 = 5.744, p = 0.0012). (I) Viral targeting of AAV5-EF1α-DIO-eArch3.0-eYFP into the LH of Vgat-IRES-Cre mice. (J) 20x confocal image showing eArch3.0-eYFP expression in the LH of a Vgat-IRES-Cre mouse. Scale bar, 200 µm. (K) Illustration for somata LH GABAergic photoinhibition. (L) Color map encoding spatial location of an example food-deprived LHGABA::eArch3.0 animal during the free-access feeding paradigm. (M) Upon photoinhibition exposure, LHGABA::eArch3.0 animals spent significantly less time in the food zone compared to controls (n = 5 mice per group, F1,16 = 9.39, p = 0.007). (N) Photoinhibition of LH GABAergic neurons significantly suppressed food intake in food-restricted mice when compared to controls and time epochs without photoinhibition (n = 5 mice per group, F1,16 = 5.43, p = 0.033). (O) LHGABA::eArch3.0 mice spent significantly less time in the photoinhibition-paired chamber compared to controls (n = 5 mice per group, t8 = 4.512, p = 0.002). All values are mean ± SEM. Student’s t-test or Two-way ANOVA, *p < 0.05, **p < 0.01, ***p < 0.001. See also Figure S1.
Figure 2
Figure 2. Bulk Chemogenetic Activation of LH GABAergic Neurons Enhances Consummatory Behaviors
(A) Viral targeting of AAV8-hSyn-DIO-hM3D(Gq)-mCherry into the LH of Vgat-IRES-Cre mice. (B) 20x confocal image showing hM3Dq-mCherry expression in the LH of a Vgat-IRES-Cre animal. Scale bar, 200 µm. (C) Example current-clamp traces from a LHGABA::hM3Dq brain slice before (baseline) and after 5 μM CNO demonstrating DREADD-mediated action potentials (bottom). (D) CNO significantly increases spontaneous firing of LHGABA::hM3Dq neurons (n = 3 cells, n = 3 mice, t4 = 12.370, p = 0.0002). (E) 20x confocal image from an example LHGABA::hM3Dq animal, where Fos-induction was assessed 2 hr after CNO (1 mg/kg; i.p.) injection. Scale bar, 500 µm. (F-H) 63x confocal images displaying Fos immunoreactivity (F) and hM3Dq-mCherry expression (G) in a LHGABA::hM3Dq animal injected with CNO. (H) Merged image of (F) and (G) showing colocalization of Fos and hM3Dq-mCherry expression as indicated by white arrows. Scale bars, 20 µm. (I) CNO administration in LHGABA::hM3Dq mice significantly increases Fos expression in the LH compared to controls and neighboring regions (n = 3 LH sections, n = 3 mice per group, F1,8 = 46.00, p < 0.0001). (J) Cumulative lick responses from individual LHGABA::hM3Dq and LHGABA::Control mice during a single 1 hr free-access caloric consumption task. (K) Systemic CNO application significantly increases lick responses in LHGABA::hM3Dq mice compared to LHGABA::Control mice and saline injections during a free-access caloric consumption task (n = 6 mice per group, F1,20 = 8.12, p = 0.01). (L) Example color maps from LHGABA::hM3Dq (top) and LHGABA::Control mice (bottom) during the free-access feeding task. (M) Systemic application of CNO in LHGABA::hM3Dq mice significantly increased food consumption during the free-access feeding task when compared to controls and saline injections (n = 6 mice per group, F1,20 = 6.37, p = 0.02). (N) Cumulative lick responses from example LHGABA::hM3Dq and LHGABA::Control animals during a single 1 hr progressive ratio 3 (PR3) session. (O) Systemic CNO application significantly increased lick responses in LHGABA::hM3Dq mice during the PR3 paradigm when compared to controls and saline injections (n = 6 mice per group, F1,20 = 24.37, p < 0.0001). (P) Nose poke responses from example LHGABA::hM3Dq and LHGABA::Control mice during a single PR3 session. (Q) CNO administration did not significantly affect nose poke responses during the PR3 session (n = 6 mice per group, F1,20 = 1.47, p = 0.24). All values are mean ± SEM. Student’s t-test or Two-way ANOVA. See also Figure S2.
Figure 3
Figure 3. Genetic Ablation of LH Vgat Neurons that are Separate from MCH and Orx Cells Attenuates Weight Gain, Food-seeking, and Consummatory Behaviors
(A-C) 20x confocal images of the dorsolateral LH demonstrating the absence of colocalization between Vgat-eYFP and MCH immunostaining (n = 223 +/− 13.77 Vgat-eYFP cells per mm2, n = 76 +/− 11.37 MCH cells per mm2, and 0% overlap, n = 3 LH sections, n = 3 Vgat-eYFP mice). Scale bars, 100 µm. (D-F) Representative 20x confocal images from a Vgat-eYFP brain slice (D) immunostained for Orx in red (E) displaying a lack of eYFP and Orx-immunoreactivity coexpression in Vgat + LH cells (F; n = 266 +/− 24.2 Vgat-eYFP cells per mm2, n = 200 +/− 4.41 Orx cells per mm2, and 0% overlap, n = 3 LH sections, n = 3 Vgat-eYFP mice). Scale bars, 100 µm. (G) Viral injection of AAV2-flex-taCasp3-TEVp into the LH of Vgat-IRES-Cre mice. (H and I) 20x confocal images demonstrating decreased GAD67 expression in LHGABA::taCasp3 mice (H) compared to LHGABA::Control animals (I). Scale bars, 200 µm. (J) GAD67 expression is significantly decreased in the LH of LHGABA::taCasp3 animals compared to LHGABA::Controls. Ablation of LH GABAergic neurons does not significantly alter GAD67-expression levels within the VMH and EP of LHGABA::taCasp3 and LHGABA::Control mice (n = 3 LH sections, n = 3 mice per group, F2,15 = 5.58, p = 0.01). (K) Ablation of LH GABAergic neurons significantly blunted weight gain induced from a calorie-dense diet (n = 7 mice per group, F1,720 = 377.01, p = 0.0174). (L) Four weeks after taCasp3-TEVp viral injection, LH GABAergic cell death significantly reduced daily consumption of a calorie-dense diet (n = 7 mice per group, t12 = 2.597, p = 0.0234). (M) Color map locations from example LHGABA::taCasp3 (top) and LHGABA::Control (bottom) mice during the free-access feeding paradigm. (N) LHGABA::taCasp3 mice display significant decreases in food consumption when compared to controls during the free-access feeding paradigm (n = 7 mice per group, t12 = 3.239, p = 0.0071). (O) LH GABAergic neuron ablation significantly decreases lick responses in LHGABA::taCasp3 animals compared to controls during a free-access caloric consumption paradigm (n = 7 mice per group, t12 = 5.3320, p = 0.0002). (P) Lick responses from example LHGABA::taCasp3 and LHGABA::Control animals during a single (1 hr) PR3 session. (Q) Ablation of LH GABAergic neurons significantly decreases lick responses in LHGABA::taCasp3 animals compared to LHGABA::Controls during the PR3 task (n = 6 mice per group, t10 = 3.024, p = 0.012). (R) Nose poke responses from example LHGABA::taCasp3 and LHGABA::Control animals during a single PR3 session. (S) Ablation of LH GABAergic neurons significantly decreases nose poke responding in LHGABA::taCasp3 animals compared to LHGABA::Controls during the PR3 task (n = 6 mice per group, t10 = 2.773, p = 0.019). (T) LHGABA::taCasp3 mice display significantly lower breakpoints when compared to LHGABA::Controls during the PR3 session (n = 6 mice per group, t10 = 2.692, p = 0.022). All values are mean ± SEM. Student’s t-test or Two-way ANOVA. See also Figures S3 and S4.
Figure 4
Figure 4. In Vivo Ca2+ Imaging of LH GABAergic Neurons in Freely Moving Mice
(A) Diagram showing unilateral viral injection of AAVDJ-EF1α-DIO-GCaMP6m into the LH of Vgat-IRES-Cre mice. (B) 10x confocal image of GCaMP6m expression in LH GABAergic neurons. Scale bar, 500 µm. (C) 63x confocal image demonstrating stable and healthy GCaMP6m expression in LH GABAergic neurons several months after viral delivery. Scale bar, 20 µm. (D) Integration of the mini-epifluorescence microscope with the microendoscope for deep-brain imaging of LH GABAergic neurons expressing GCaMP6m. (E) 20x confocal image showing lens (microendoscope) placement and GCaMP6m-expressing neurons within the LH. Focal plane in tissue is 300 µm from the bottom of the lens as indicated by the dashed red box. Scale bar, 500 µm. (F) In vivo mini-epifluorescence image of GCaMP6m expression in the LH. Green arrow directs to a LH GABAergic neuron expressing GCaMP6m. Red arrow highlights a blood vessel. Scale bar, 100 µm. (G) Illustration of the in vivo Ca2+ imaging setup. (H) Schematized cell map of an example animal’s LH GABAergic neurons visualized during free-access feeding and PR3 tasks. The same neurons can be tracked between sessions (colored cells). (I) Ca2+ traces of individual neurons tracked in (H). See also Figure S5.
Figure 5
Figure 5. Subsets of LH GABAergic Neurons Display Enhanced or Reduced Activity to Environmental Locations Containing Food.
(A) Example trace of animal’s location during the free-access feeding task. (B and C) Spatial Ca2+ activity maps of a single FZe (B) and FZi (C) cell. Behavioral arena is divided into 0.33 × 0.33 cm bins, where number of Ca2+ events per unit time is represented in color. (D and E) Example Ca2+ traces from one FZe (orange; D) and one FZi (blue; E) cell during the free-access feeding task in relation to animal’s location and state of interaction with food. (F) Distribution of food zone (FZ) responses from all detected cells (mean = 0.0, sd = 0.3). FZe cells are classified as above one standard deviation (sd) from the mean. FZi cells fall below one standard deviation from the mean (n = 612 total cells imaged, n = 87 FZe cells, n = 73 FZi cells, n = 6 mice). (G and H) Average Ca2+ transients per min for FZe (G) and FZi (H) cells in each zone (n = 87 FZe cells, t86 = 14.92, p < 0.0001, n = 73 FZi cells, t72 = 15.08, p < 0.0001). (I) Example cell map with cells’ color encoding response to FZ. Scale bar, 100 µm. Error bars represent SEM. Student’s t-test. See also Figure S6.
Figure 6
Figure 6. Separate LH GABAergic Neurons Selectively Encode Aspects of Appetitive or Consummatory Behaviors
(A) Ca2+ response to consummatory licks. (Top) Ca2+ response to individual consummatory licks from an example cell. (Bottom) Average Ca2+ response to all consummatory licks from the example cell. (B) Ca2+ response to nose pokes. (Top) Ca2+ response to individual nose pokes from an example cell. (Bottom) Average Ca2+ response to all nose pokes from the example cell. (C and D) Cell activity maps from an example animal. Color codes consummatory lick or appetitive nosepoke responses (average difference between Ca2+ signals from 1.5 s before and after the respective event) for each cell. Scale bars, 100 µm. (E) Average Ca2+ response to consummatory licks following reward delivery from all excited cells from all animals. (Top) Average Ca2+ response to consummatory licks following reward delivery from all cells. (Bottom) Ca2+ response to consummatory licks averaged across cells excited by consummatory licks (n = 75 lick excited, n = 743 total cells). (F) Average Ca2+ response to nose pokes from all excited cells of all animals. (Top) Average Ca2+ response to nose pokes from all cells. (Bottom) Ca2+ response to nose pokes averaged across cells excited by nose pokes (n = 168 nose poke excited, n = 743 total cells). (G) Cell map from example animal. Cells excited by consummatory licks (cyan), nose pokes (yellow), or both (green). Scale bar, 100 µm. (H) Venn diagram representing distribution and overlap of classified responsive cells in the PR3 task. Green shaded regions represent SEM. See also Figure S7.
Figure 7
Figure 7. Tracking the Activity Dynamics of Individual LH GABAergic Neurons Across Separate Behavioral Tasks
(A) Cell map from example animal during free-access feeding task. (B) Cell map from same example animal during PR3 appetitive task. (C) Merge of free-access feeding and PR3 appetitive task cell maps from same example animal. (D) Distribution of nearest neighbor distances between cells of different behavioral tasks but within the same animal for all subjects. (E) Distribution of nearest-neighbor distances between all cells within the same behavioral task and imaging session. (F) Distribution of cell responses in free-access feeding task of only paired cells (n = 472 cells from 6 mice, n = 73 FZe cells, n = 52 FZi cells). (G-I) Maps of only paired cells from an example animal across the free-access feeding and PR3 tasks. Scale bars, 100 µm. (J) Bar graph showing cells that respond in both the free-access feeding and PR3 tasks.

Comment in

References

    1. Adamantidis A, de Lecea L. The hypocretins as sensors for metabolism and arousal. J. Physiol. 2009;587:33–40. - PMC - PubMed
    1. Adamantidis AR, Tsai H-C, Boutrel B, Zhang F, Stuber GD, Budygin EA, Touriño C, Bonci A, Deisseroth K, de Lecea L. Optogenetic interrogation of dopaminergic modulation of the multiple phases of reward-seeking behavior. J. Neurosci. Off. J. Soc. Neurosci. 2011;31:10829–10835. - PMC - PubMed
    1. Alexander GM, Rogan SC, Abbas AI, Armbruster BN, Pei Y, Allen JA, Nonneman RJ, Hartmann J, Moy SS, Nicolelis MA, et al. Remote control of neuronal activity in transgenic mice expressing evolved G protein-coupled receptors. Neuron. 2009;63:27–39. - PMC - PubMed
    1. Allen GV, Cechetto DF. Neurotensin in the lateral hypothalamic area: origin and function. Neuroscience. 1995;69:533–544. - PubMed
    1. Anand BK, Brobeck JR. Hypothalamic Control of Food Intake in Rats and Cats. Yale J. Biol. Med. 1951;24:123–140. - PMC - PubMed

Publication types