. 2015 Jan 29;160(3):554-66.
doi: 10.1016/j.cell.2015.01.006.

Enhancer evolution across 20 mammalian species

Affiliations

Enhancer evolution across 20 mammalian species

Diego Villar et al. Cell. .

Abstract

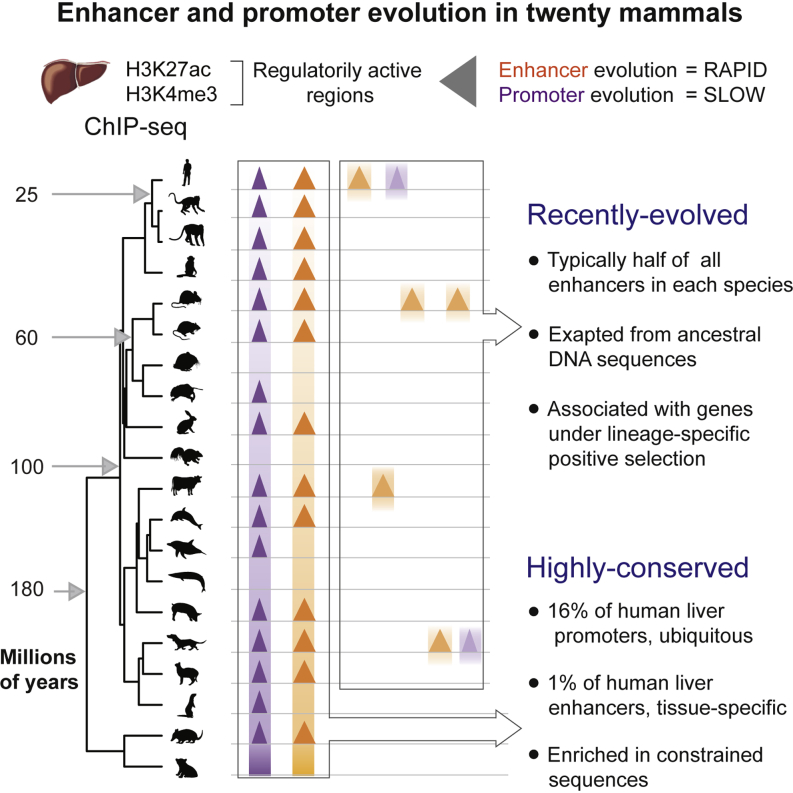
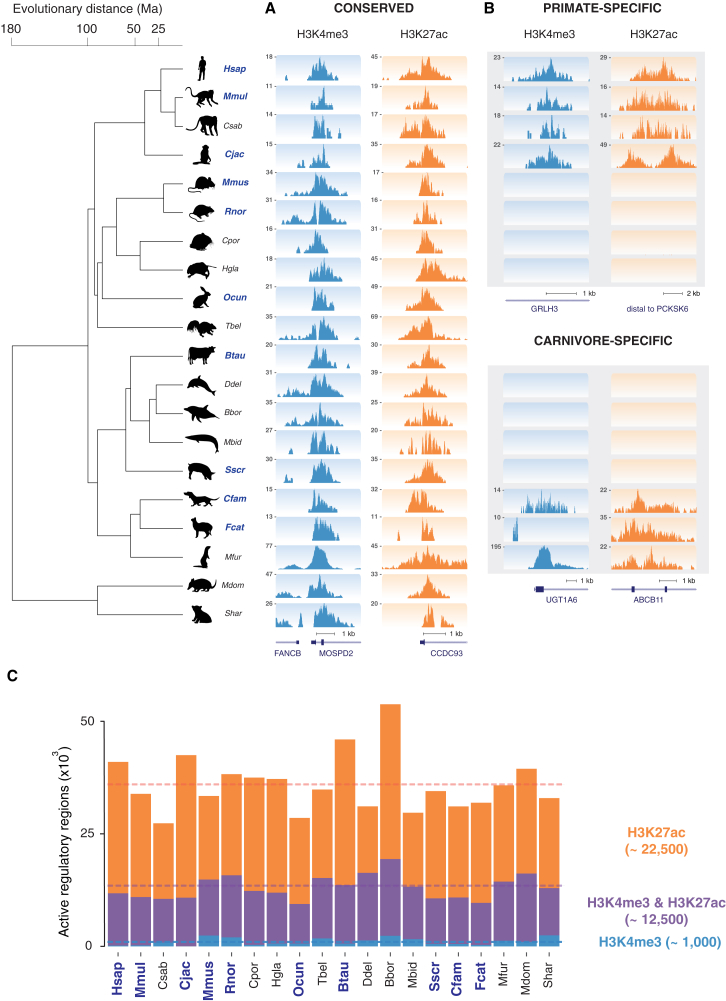
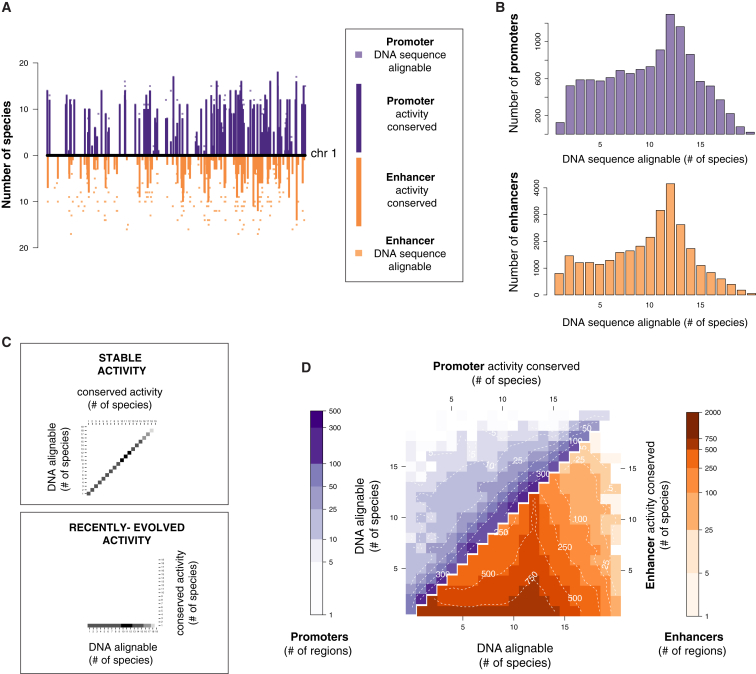
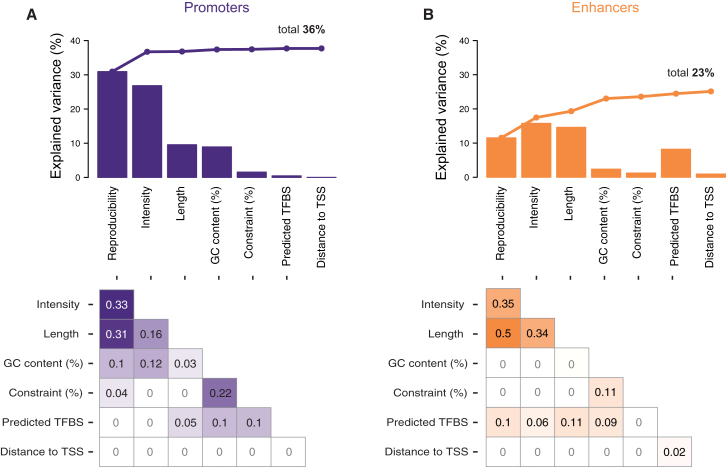
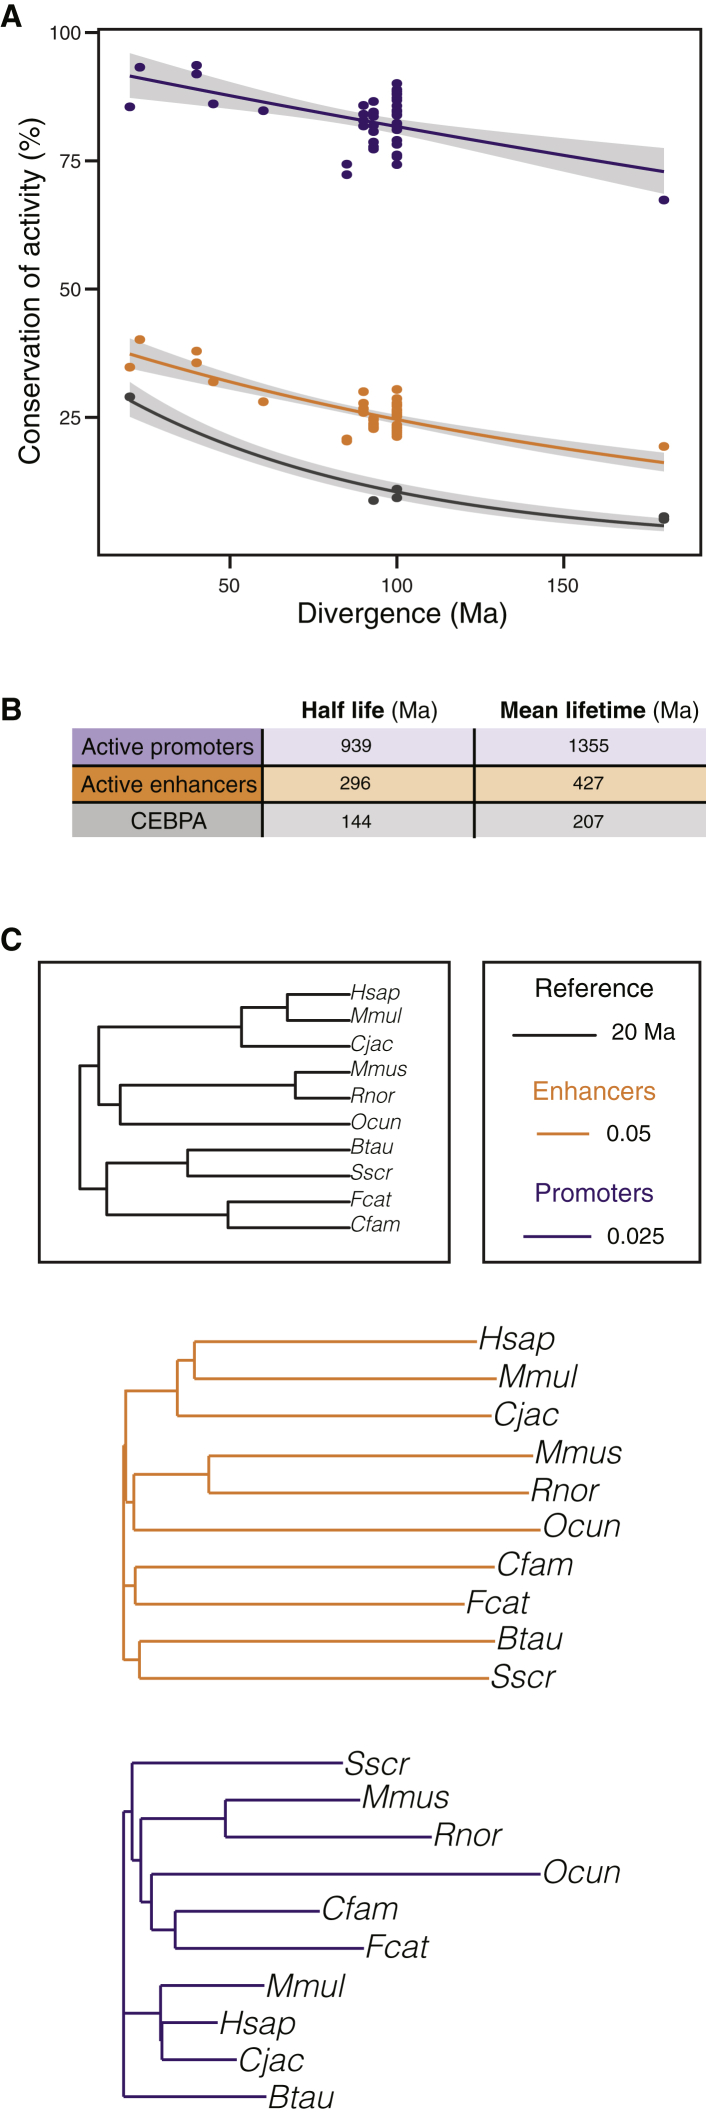
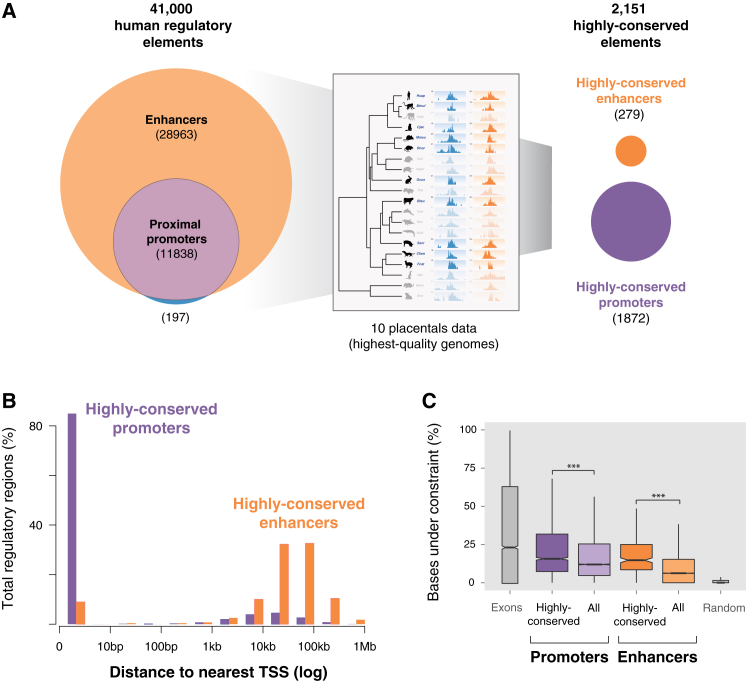
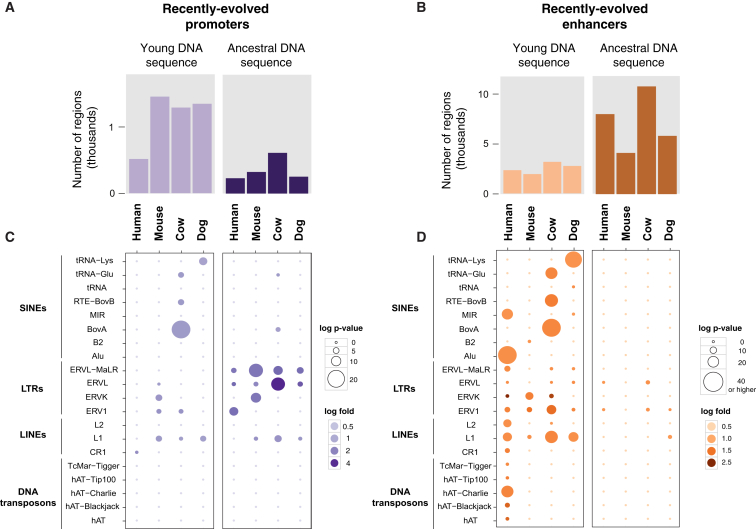
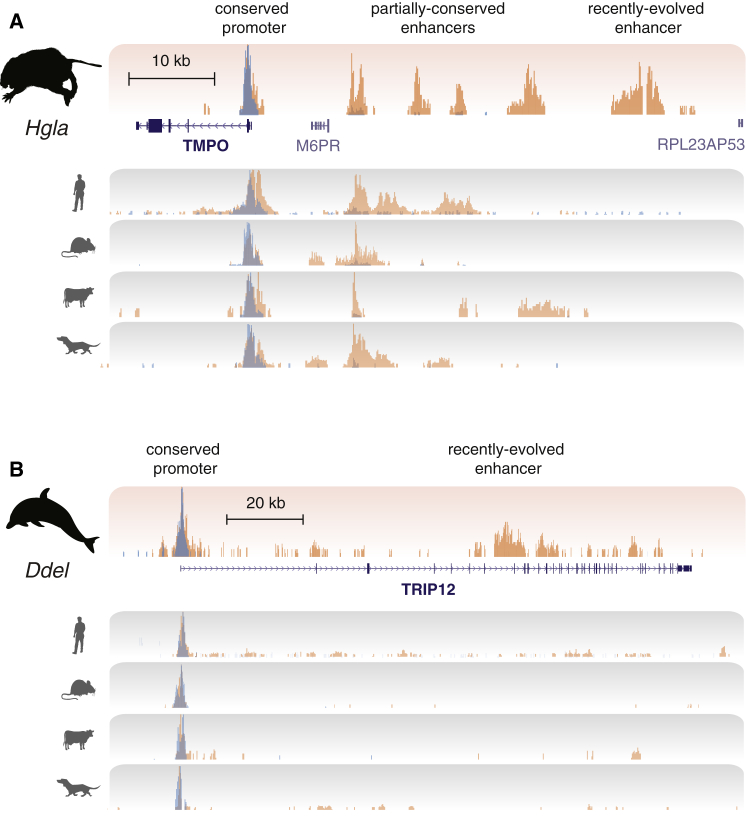
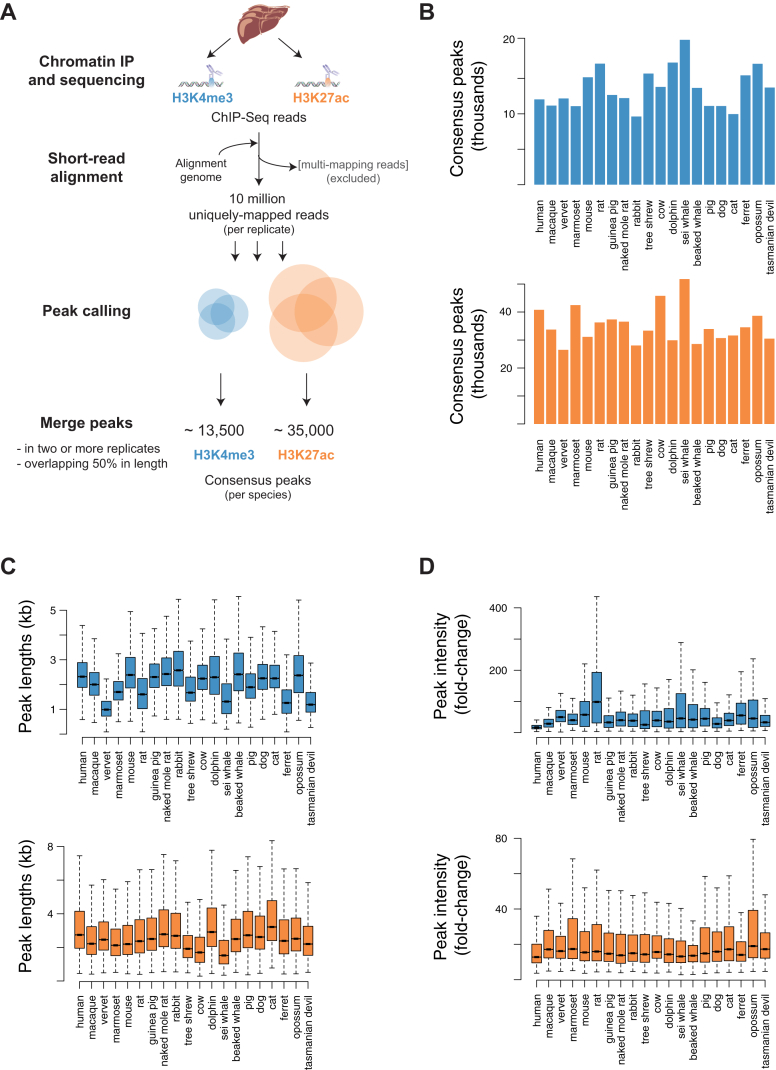
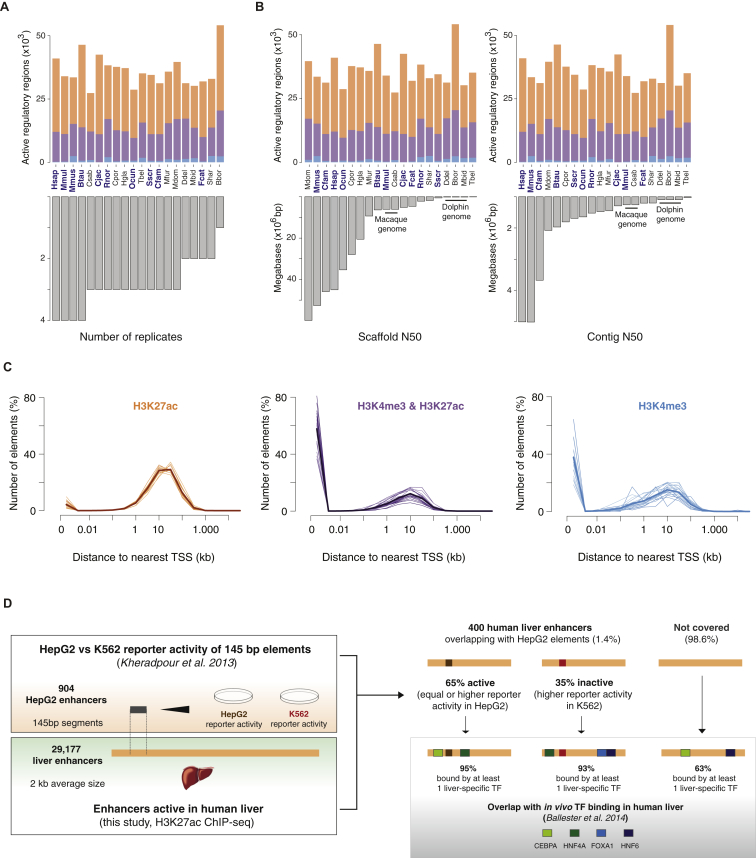
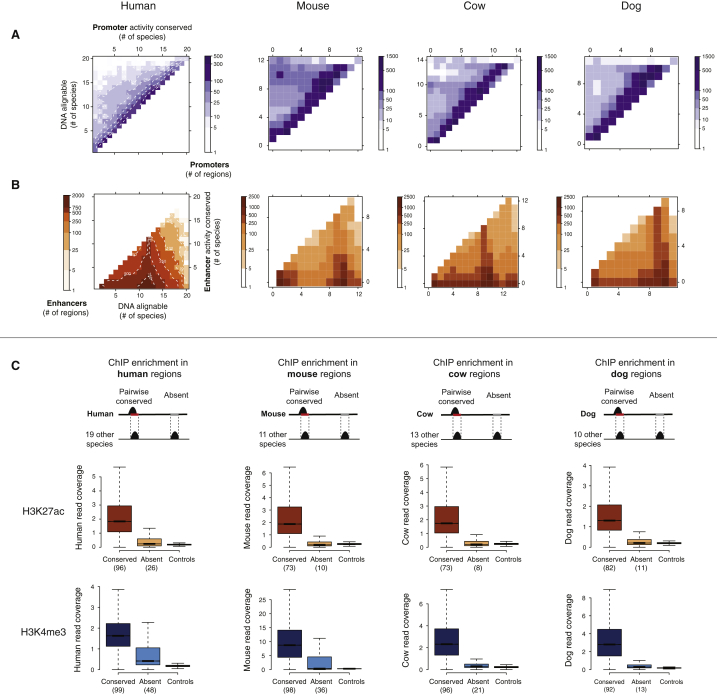
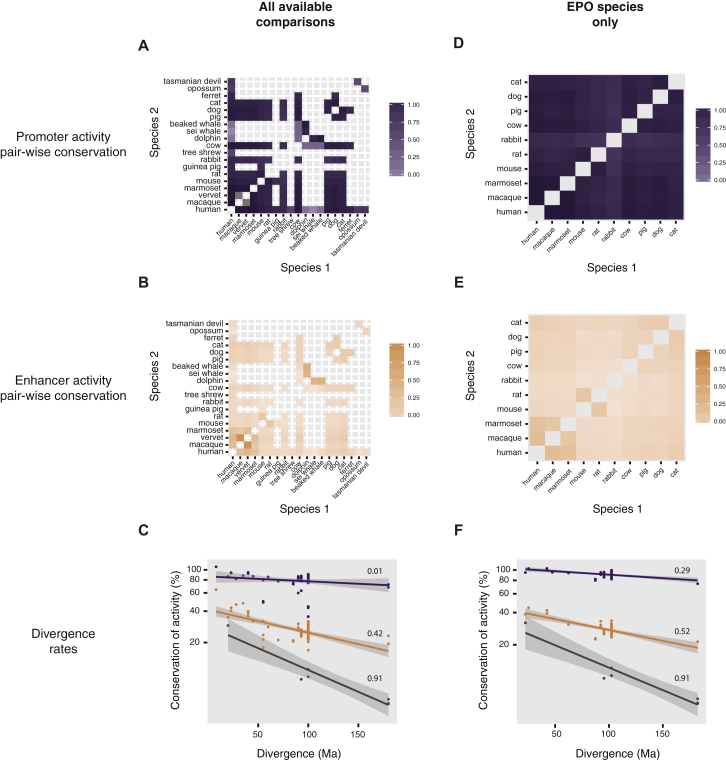
The mammalian radiation has corresponded with rapid changes in noncoding regions of the genome, but we lack a comprehensive understanding of regulatory evolution in mammals. Here, we track the evolution of promoters and enhancers active in liver across 20 mammalian species from six diverse orders by profiling genomic enrichment of H3K27 acetylation and H3K4 trimethylation. We report that rapid evolution of enhancers is a universal feature of mammalian genomes. Most of the recently evolved enhancers arise from ancestral DNA exaptation, rather than lineage-specific expansions of repeat elements. In contrast, almost all liver promoters are partially or fully conserved across these species. Our data further reveal that recently evolved enhancers can be associated with genes under positive selection, demonstrating the power of this approach for annotating regulatory adaptations in genomic sequences. These results provide important insight into the functional genetics underpinning mammalian regulatory evolution.


Figures

None
Graphical abstract
Figure 1
Figure 1
In Vivo Regulatory Activity Assessed in Livers from 20 Mammals (A and B) Phylogenetic relationships and species divergences are represented by an evolutionary tree, which includes 18 placental species (in four orders) and 2 marsupial species (in two orders). In liver isolated from each species, enhancer activity was globally mapped by identifying genomic regions enriched for acetylation of H3K27 (H3K27ac), and transcription initiation was mapped by identifying genomic regions enriched for tri-methylation of H3K4 (H3K4me3). Shown are examples of regulatory regions active: (A) across all 20 species (MOSPD2 and CCDC93 loci), and (B) active only in primates (GRLH3 and PCKSK8, top) or active only in carnivores (UGT1A6 and ABCB11, bottom). For order-specific regulatory regions, data from some species are not shown for conciseness. (C) In liver, a typical mammalian genome contains ∼22,500 enhancers enriched for only H3K27ac; ∼12,500 promoters enriched for both H3K27ac and H3K4me3 and ∼1,000 containing only H3K4me3. Highest quality genomes incorporated into the EPO multiple alignment are labeled in blue (Experimental Procedures). See also Figures S1 and S2 and Tables S1 and S2.
Figure 2
Figure 2
Enhancers Evolve Rapidly; Promoters Are Highly Conserved (A) For a representative 10 MB region on human chromosome 1, the bar chart on the y axis represents the number of species in which enhancer and promoter elements were active (promoters: top, purple; enhancers: bottom, orange). Squares indicate the number of species where the sequence underlying the active promoter or enhancer was alignable. (B) The DNA sequences underlying proximal promoters and the DNA sequences underlying enhancers can be aligned to similar numbers of species, suggesting that differences in apparent conservation of activity are not due to differences in alignability. (C) Schematic diagram showing how the conservation of regulatory activity versus DNA alignability across 20 species of mammals can reveal (top) where DNA function and DNA sequence orthology closely correspond, indicating ancestral activity, and (bottom) where pre-existing DNA sequences have been exapted within specific lineages or species, indicating recently evolved activity. (D) Our data revealed that if the DNA underlying a human-identified proximal promoter region (purple) can be aligned with an orthologous sequence in another species, then promoter activity is very often present as well (heatmap enrichment concentrated on the diagonal of the plot). In contrast, most enhancer regions (orange) are rapidly evolving within older DNA sequences, reflected in increased heatmap enrichment toward the lower x axis. Color scales and dashed contour lines indicate absolute numbers of active promoter or enhancer regions (logarithmic scale). See also Figure S3.
Figure 3
Figure 3
Features Contributing to Conservation of Promoter and Enhancer Activity Identified in Human Liver (A) For all human proximal promoters active in liver, the depth of conservation was correlated with experimental features (reproducibility, peak intensity, peak length, distance to nearest transcription start site) as well as underlying genomic features (GC content, sequence constraint, TF binding sites). Each feature in isolation explained a significant fraction of the variance in conservation of promoter activity (e.g., peak length explained 10%). The fraction explained by the features in combination, when added left to right using multiple regression analysis, are plotted as a line above, in sum totaling 36%. The increases in explained variance with the addition of each feature are attenuated due to strong inter-correlation of features, quantified in the bottom panel as R2 values between features (Experimental Procedures). (B) The same analysis was performed for human liver enhancers, where experimental and genomic features together explained a more modest fraction (23%) of the conservation of enhancer activity in other species.
Figure 4
Figure 4
Empirically Determined Rates of Promoter, Enhancer, and TF Binding Divergence in Liver across 180 Million Years of Mammalian Evolution (A) For promoters (purple), enhancers (orange), and TF binding sites (CEBPA, black), the fraction of ChIP-seq peaks present at the orthologous location between pairs of mammals are shown as a function of evolutionary distance. Solid lines represent an exponential decay fit, surrounded by gray shading of a 95% confidence interval (Experimental Procedures). For liver promoters and enhancers, we used data from the ten highest-quality placental genomes, while CEBPA data have been previously reported (Schmidt et al., 2010). (B) Comparative half-lives and mean-lifetimes (in million years) for active promoters, enhancers and CEBPA transcription factor binding locations, as calculated from the exponential decay fits in (A). (C) Neighbor-joining phylogenetic trees based on pairwise conservation levels of enhancer and promoter activity, as measured in (A). Enhancer evolution (orange) recapitulates the known relationships among the studied mammals (black). The low divergence of promoter activity is insufficient to resolve the phylogenetic groups (purple). See also Figure S4.
Figure 5
Figure 5
Most Highly Conserved Liver Regulatory Regions Are Proximal Promoters (A) The ∼41,000 regulatorily active regions in human liver are shown on the left panel (enhancers: orange; promoters: purple). The regulatory elements with conserved activity in the ten placental species with highest quality genomes (boxed inset) were determined by cross-species comparison (Experimental Procedures), identifying approximately 300 enhancers and 1,800 promoters (labeled as highly conserved, right panel). (B) Almost all highly conserved promoter regions (purple) are located at transcription start sites as expected, whereas conserved enhancer regions (orange) are typically tens to hundreds of kilobases from the nearest gene. (C) Regions of highly conserved enhancer and promoter activity show a corresponding, but modest, increase in selective constraint in their underlying DNA sequence. The distribution of the fraction of bases under constraint in each region within each category is shown as a box-plot, with human exons and randomly selected regions shown for comparison (Experimental Procedures).∗∗∗ indicates p value < 2 × 10−16, Wilcoxon test. See also Figures S5 and S6 and Tables S3, S6, and S7.
Figure 6
Figure 6
Recently Evolved Promoters Are Largely Derived from Young DNA, While Recently Evolved Enhancers Are Mostly Exapted from Ancestral DNA Sequences Regions with recently evolved promoter and enhancer activity in liver were identified in a representative species for each placental order (primate:human, rodent:mouse, ungulate:cow, and carnivore:dog). These regions were categorised into those falling in (1) young DNA sequences (0–40 Ma) or (2) ancestral DNA sequences (>100 Ma). (A) Typically three times as many recently evolved active promoters reside in young DNA as are found in ancestral DNA sequences present across placental mammals. (B) Conversely, typically twice as many recently evolved enhancers are exapted from evolutionarily ancestral DNA as are found in young DNA. (C and D) Repeat classes and families enriched in recently evolved promoters and enhancers were identified using a binomial test (see Experimental Procedures). Plots show enrichments for each repeat family (y axis) and each species (x axis). Circle sizes represent the statistical significance of enrichment, and color shades denote the fold change of the enrichment (both in logarithmic scale). See also Figures S6 and S7 and Tables S3, S4, S6, and S7.
Figure 7
Figure 7
Recently Evolved Enhancers Associate with Genes under Positive Selection during Naked Mole Rat and Dolphin Evolution (A) The liver enhancer and promoter landscape surrounding the TMPO locus, which is under positive selection in naked mole rat (Kim et al., 2011), is shown (upper track). The bottom four tracks display overlaid H3K4me3 (blue) and H3K27ac (orange) levels in the orthologous regions of human, mouse, dog, and cow. Shown (left to right) are a promoter present in all species, four enhancer regions shared in a subset of species, and a naked mole rat-specific enhancer whose recently evolved activity is not present in other study species. (B) The enhancer and promoter landscape surrounding the TRIP12 locus, which is under positive selection in dolphins (Sun et al., 2013), is shown. In this case, no mammals other than dolphin show liver enhancer activity near this gene; this enhancer is thus a good candidate to contain the regulatory regions associated with positive selection in dolphin. See also Table S5.
Figure S1
Figure S1
Analysis Workflow and Quality Control of H3K4me3 and H3K27ac ChIP-Seq in 20 Mammals, Related to Figure 1 (A) Short-read alignment and peak calling workflow (see also Extended Experimental Procedures) (B) Numbers of consensus peaks identified for H3K4me3 (blue) or H3K27ac (orange) in each species’ liver tissue. (C) Length distributions of consensus H3K4me3 (blue) or H3K27ac (orange) peaks are represented as boxplots for each species. (D) Peak intensity distributions are represented as boxplots for each species’ data (H3K4me3, blue; H3K27ac, orange). Peak intensities correspond to average fold enrichment values over total input DNA across biological replicates (see Extended Experimental Procedures).
Figure S2
Figure S2
Quality Control of Experimental Promoter and Enhancer Definition, Related to Figure 1 (A) Numbers of experimentally identified promoters (H3K4me3&H3K27ac, purple; H3K4me3, blue) and enhancers (H3K27ac, orange) per species are represented as stacked barplots in the upper plot, ordered by decreasing number of biological replicates used for each species (lower plot). Except for Bbor (Balaenoptera borealis), where a single replicate was used, the number of biological replicates has little influence on the number of active regulatory regions identified per species. (B) As in (A), but numbers of promoters/enhancers in each species are now ordered by decreasing scaffold or contig N50 values, both indicative of genome assembly quality. Species highlighted in blue correspond to genomes in the EPO multiple alignment, considered to be the highest-quality reference genomes. Assembly qualities do not appear to influence experimental variation in the number of promoters or enhancers identified in each species. (C) The distribution of distances to the nearest transcriptional start site (TSS) was calculated for all experimentally identified regions in each species’ data (thin lines). Bolded lines represent the average distance distribution across all species for H3K4me3 (blue), H3K4me3&H3K27ac (purple) and H3K27ac (orange) elements. In agreement with their categorisation as enhancer elements, in all species most H3K27ac locations are distal to coding regions. Both H3K4me3 and H3K4me3&H3K27ac elements are largely located close to annotated TSSs consistent with being proximal promoters. The minority of distal elements marked by H3K4me3 or H3K4me3&H3K27ac may correspond to unannotated transcripts; further, the latter may also act as enhancers (Kim et al., 2010). (D) H3K27ac-defined enhancers enrich for regulatory activity: Human liver enhancers identified in this study through H3K27ac ChIP-seq (bottom inset) were overlapped with 145 bp sequence elements assayed for reporter activity in human liver carcinoma (HepG2) and human erythroleukemia cells (K562) (top inset; Kheradpour et al., 2013). These correspond to enhancer candidates identified in HepG2 cells and containing motifs for liver-specific transcription factors. Four hundred human liver enhancers contained at least one 145 bp segment (1.1 segments per enhancer on average). 65% of these enhancers were active based on the reporter activity of the assayed segments, which displayed higher activity in HepG2 compared to K562 cells, or equal activity in both cell lines. The remaining 35% human liver enhancers overlapped segments having higher activity in K562 cells, and were thus classified as inactive in HepG2 cells. Grey inset: Human liver enhancers identified in this study were overlapped with in vivo binding locations for four liver-specific transcription factors, as reported independently in human liver samples (Ballester et al., 2014). Among the 400 enhancers containing segments assayed in Kheradpour et al., 93%–95% of them were bound by at least one liver-specific TF, regardless of the reporter activity of their overlapping segments. This suggests that in cases where the overlapping segment was inactive in the reporter assay, the corresponding enhancer may harbor regulatory activity outside the interrogated sequence. Across all liver enhancers in human, 63% are bound by at least one of the four liver-specific transcription factors, in line with previous estimates of functional enhancer activity in H3K27ac-marked regions (Nord et al., 2013).
Figure S3
Figure S3
Conservation of Activity Assessed in Four Representative Mammals, Related to Figure 2 (A and B) Regardless of the species used as a reference, liver promoter activity (A) is usually conserved in most species where an orthologous region (i.e., DNA alignable) can be found. Conversely, enhancer activity (B) evolves rapidly and is typically conserved across few species, although the DNA sequences underlying enhancers can usually be aligned across a larger number of mammals than those with enhancer activity. (C) Assessment of false negatives in pairwise species comparisons: raw sequence read counts were calculated within a reference species (for instance, human, far left diagram) at sites that are orthologous to active regions in other species in the dataset. These sites can either be conserved, if the region is active in human also; or non-conserved (“Absent”), if it is not detected as active in human. Some absent regions may contain promoter or enhancer activity that falls below either the significance threshold or the reproducibility criteria used for peak calling (Figure S1), and thus would represent false negatives. Boxplots below each diagram represent distributions of read coverage at conserved and absent regions, using data from four different reference species (human, mouse, cow, and dog) for each histone mark. For each region, a single coverage value was calculated, corresponding to the average coverage over replicates after normalization for total library size. Read coverage at these sites in the total DNA controls (no antibody) was used as a control distribution. Numbers under each “Conserved” or “Absent” box indicate the percentage of regions with read coverage in the upper tail of the control distribution (> mean + 1.96sd). In most cases, coverage at absent sites is very similar to the control and markedly different from conserved regions, indicating low false negative rates. A proportion of human and mouse H3K4me3 absent sites display higher read coverage than the control, suggesting that conservation of promoter activity may be even higher than reported in our main analyses.
Figure S4
Figure S4
Experimentally Determined Rates of Promoter and Enhancer Evolution across Mammals, Related to Figure 4 (A–F) The average fraction of regions with pairwise conserved activity for promoters (purple) or enhancers (orange) represented as heatmaps, as measured for: (1) all available comparisons in the dataset (A and B), using the 13 eutherian mammals Ensembl EPO multiple alignment where possible and ad hoc LastZ pairwise alignments otherwise (see Extended Experimental Procedures). (2) only species in the 13 eutherian mammals Ensembl. EPO multiple alignment (D and E), corresponding to the higher-quality reference genomes in the dataset. The choice of species and alignments had no significant influence on the rates, as calculated by an exponential decay fit to either set of comparisons. Percent conservation (y axis) is shown in logarithmic scale, and numbers above each dataset represent R2 values for the exponential decay fit (C and F). The regressions (solid lines) in (C) were used to calculate the estimated half-lives and mean lifetimes in Figure 4 (promoters: half-life 939 Ma [641-1760], mean lifetime 1355 Ma [924-2539]; enhancers: half-life 296 Ma [231-408]; mean lifetime 427 Ma [334-589]; CEBPA binding sites: half-life 144 Ma [103-237]; mean lifetime 207 Ma [148-342]). Numbers in square brackets indicate 95% confidence intervals for each value.
Figure S5
Figure S5
Additional Properties of Highly Conserved Promoters and Enhancers, Related to Figure 5 (A) The distribution of distances to the nearest TSS is almost identical between highly conserved promoters or enhancers (darker purple and orange, respectively) and all experimentally identified promoters/enhancers in human (lighter purple and orange bars). (B) Average expression of genes associated to highly conserved promoters and enhancers across a panel of 16 human tissues (Petryszak et al., 2014). Highly conserved enhancers are associated with genes showing a higher average expression in liver, especially for the top 50% H3K27ac intensities (“high intensity (K27)”). Conversely, highly conserved promoters are largely associated with ubiquitously expressed genes, although promoters with high H3K27ac intensity also associate with high liver gene expression. Expression profiles for genes associated with all promoters and enhancers identified in human were used as background to normalize expression values (see Extended Experimental Procedures). (C) Sequence motifs specifically enriched in highly conserved promoters and enhancers, using all experimentally identified promoters or enhancers in human as a background control. The ten most-enriched motifs are shown, and enrichment p values are represented as heatmaps (logarithmic scale). (D) Gene ontology annotations for biological processes enriched near highly conserved promoters and enhancers. Liver-related annotations such as blood coagulation, glucose homeostasis or bile acid biosynthesis are found for highly conserved enhancers, in line with their association to liver-specific genes.
Figure S6
Figure S6
Expression Levels of Genes Associated to Highly Conserved or Recently Evolved Promoters and Enhancers, Related to Figures 5 and 6 (A) Previously reported gene expression data in human and mouse liver (Brawand et al., 2011) was integrated with highly conserved and recently evolved promoters and enhancers, as identified in this study using livers from the same species (see Experimental Procedures). (B and C) For human (B) and mouse (C), normalized gene expression levels (average RPKM, logarithmic scale) were quantified for genes associated with: (1) any promoter or enhancer active in liver, (2) at least one highly conserved promoter or enhancer, (3) only highly conserved promoter(s) or enhancer(s), or (4) and (5) the same associations with recently evolved promoters and enhancers. Liver promoter or enhancer activity is associated in all cases with gene expression levels above background (“All genes”).
Figure S7
Figure S7
Additional Properties of Recently Evolved Promoters and Enhancers, Related to Figure 6 (A) Recently evolved promoters and enhancers identified in primates (human), rodents (mouse), ungulates (cow) and carnivores (dog) were categorised by the age of their underlying DNA sequence. Most recently evolved promoters and enhancers lie either in young DNA (0–40 Ma, lighter purple and orange shades) or ancestral DNA (> 100 Ma, darkest purple and orange), but a few promoters or enhancers lie in sequences of intermediate age (40–100 Ma). (B) Recently evolved promoters and enhancers contain similar proportions of sequences annotated as repetitive elements, regardless of the age of the underlying DNA, as shown for human in violin plots. For both promoters and enhancers, recently evolved elements located in ancestral or young DNA sequences were compared with all human promoters or enhancers (“All regions”). (C) Recently evolved promoters are significantly associated with non-coding RNA annotations, especially when lying in ancestral DNA sequences (p value < 0.0001, ancient DNA promoters; p value < 0.05, recent DNA promoters; proportion tests with Bonferroni correction). (D) Recently evolved human promoters associate with a high average expression in liver, compared to all identified promoters in human. Conversely, recently evolved human enhancers are not specifically enriched in liver-specific gene expression when compared to all enhancer elements identified in human (see also Figure S5 and Extended Experimental Procedures). Note that for simplicity low-intensity H3K4me3 and low-intensity H3K27ac promoters are not shown. (E) Sequence motifs enriched in recently evolved human promoters and enhancers residing in ancestral or young DNA, using all identified promoters or enhancers in human as a background control. Only the ten most enriched motifs are shown, and enrichment p values are represented as heatmaps (logarithmic scale).

Similar articles

Cited by

References

    1. Aldridge S., Watt S., Quail M.A., Rayner T., Lukk M., Bimson M.F., Gaffney D., Odom D.T. AHT-ChIP-seq: a completely automated robotic protocol for high-throughput chromatin immunoprecipitation. Genome Biol. 2013;14:R124. - PMC - PubMed
    1. Alföldi J., Lindblad-Toh K. Comparative genomics as a tool to understand evolution and disease. Genome Res. 2013;23:1063–1068. - PMC - PubMed
    1. Andersson R., Gebhard C., Miguel-Escalada I., Hoof I., Bornholdt J., Boyd M., Chen Y., Zhao X., Schmidl C., Suzuki T., FANTOM Consortium An atlas of active enhancers across human cell types and tissues. Nature. 2014;507:455–461. - PMC - PubMed
    1. Arnold C.D., Gerlach D., Spies D., Matts J.A., Sytnikova Y.A., Pagani M., Lau N.C., Stark A. Quantitative genome-wide enhancer activity maps for five Drosophila species show functional enhancer conservation and turnover during cis-regulatory evolution. Nat. Genet. 2014;46:685–692. - PMC - PubMed
    1. Ballester B., Medina-Rivera A., Schmidt D., Gonzàlez-Porta M., Carlucci M., Chen X., Chessman K., Faure A.J., Funnell A.P., Goncalves A. Multi-species, multi-transcription factor binding highlights conserved control of tissue-specific biological pathways. eLife. 2014;3:e02626. - PMC - PubMed

Supplemental References

    1. Cooper G.M., Stone E.A., Asimenos G., Green E.D., Batzoglou S., Sidow A., NISC Comparative Sequencing Program Distribution and intensity of constraint in mammalian genomic sequence. Genome Res. 2005;15:901–913. - PMC - PubMed
    1. Gentleman R.C., Carey V.J., Bates D.M., Bolstad B., Dettling M., Dudoit S., Ellis B., Gautier L., Ge Y., Gentry J. Bioconductor: open software development for computational biology and bioinformatics. Genome Biol. 2004;5:R80. - PMC - PubMed
    1. Grant C.E., Bailey T.L., Noble W.S. FIMO: scanning for occurrences of a given motif. Bioinformatics. 2011;27:1017–1018. - PMC - PubMed
    1. Heinz S., Benner C., Spann N., Bertolino E., Lin Y.C., Laslo P., Cheng J.X., Murre C., Singh H., Glass C.K. Simple combinations of lineage-determining transcription factors prime cis-regulatory elements required for macrophage and B cell identities. Mol. Cell. 2010;38:576–589. - PMC - PubMed
    1. Kim T.K., Hemberg M., Gray J.M., Costa A.M., Bear D.M., Wu J., Harmin D.A., Laptewicz M., Barbara-Haley K., Kuersten S. Widespread transcription at neuronal activity-regulated enhancers. Nature. 2010;465:182–187. - PMC - PubMed

Publication types

Substances