. 2015 Jun;9(6):1352-64.
doi: 10.1038/ismej.2014.220. Epub 2015 Jan 30.

A multitrophic model to quantify the effects of marine viruses on microbial food webs and ecosystem processes

Affiliations

A multitrophic model to quantify the effects of marine viruses on microbial food webs and ecosystem processes

Joshua S Weitz et al. ISME J. 2015 Jun.

Abstract

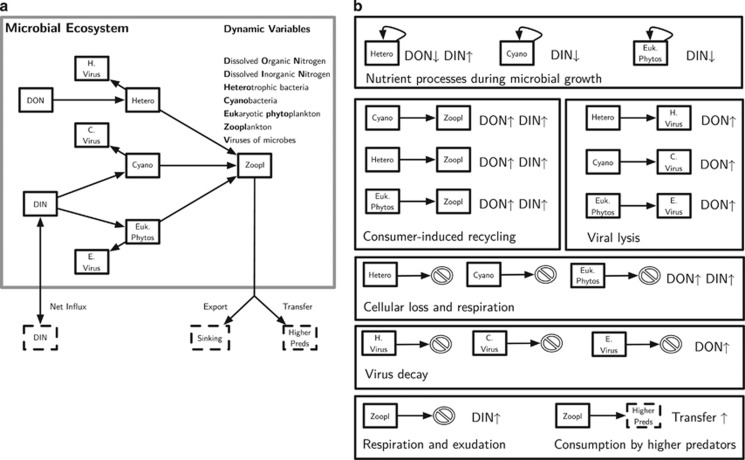
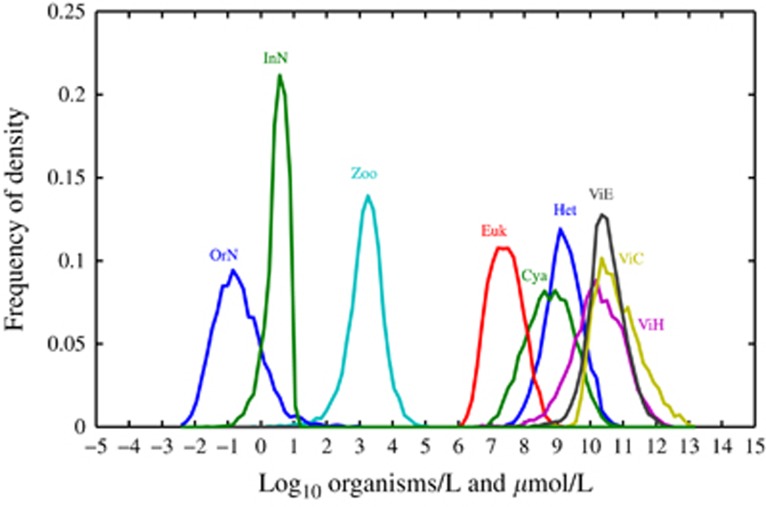
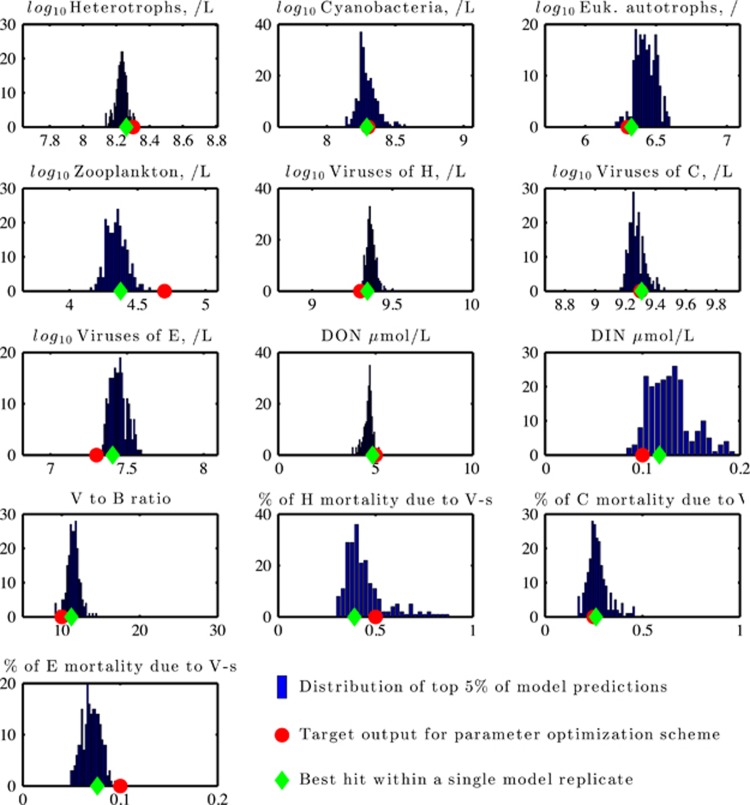
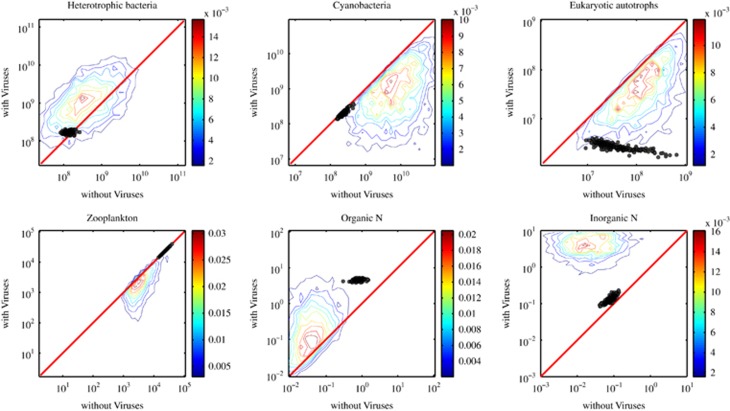
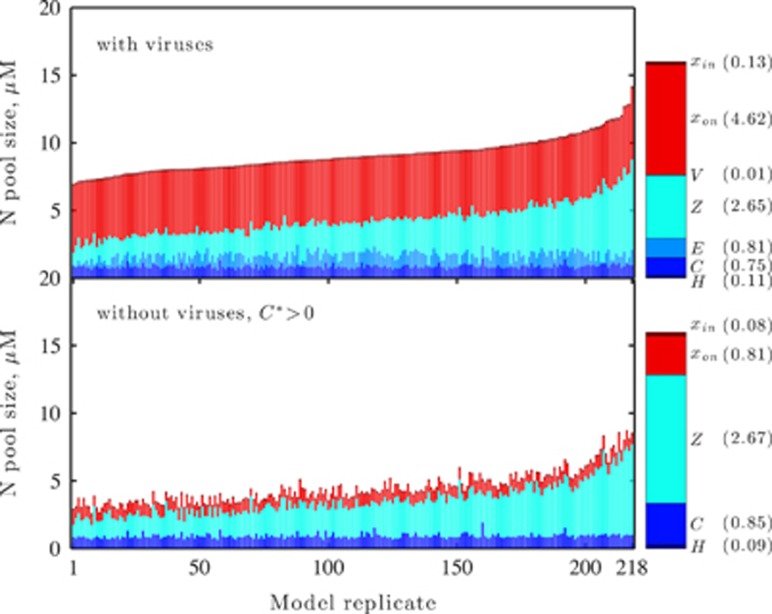
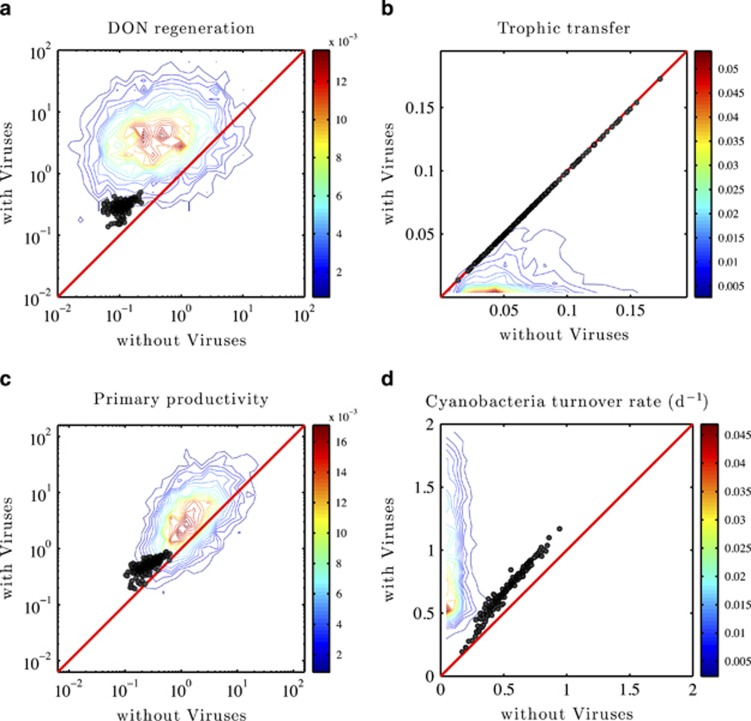
Viral lysis of microbial hosts releases organic matter that can then be assimilated by nontargeted microorganisms. Quantitative estimates of virus-mediated recycling of carbon in marine waters, first established in the late 1990s, were originally extrapolated from marine host and virus densities, host carbon content and inferred viral lysis rates. Yet, these estimates did not explicitly incorporate the cascade of complex feedbacks associated with virus-mediated lysis. To evaluate the role of viruses in shaping community structure and ecosystem functioning, we extend dynamic multitrophic ecosystem models to include a virus component, specifically parameterized for processes taking place in the ocean euphotic zone. Crucially, we are able to solve this model analytically, facilitating evaluation of model behavior under many alternative parameterizations. Analyses reveal that the addition of a virus component promotes the emergence of complex communities. In addition, biomass partitioning of the emergent multitrophic community is consistent with well-established empirical norms in the surface oceans. At steady state, ecosystem fluxes can be probed to characterize the effects that viruses have when compared with putative marine surface ecosystems without viruses. The model suggests that ecosystems with viruses will have (1) increased organic matter recycling, (2) reduced transfer to higher trophic levels and (3) increased net primary productivity. These model findings support hypotheses that viruses can have significant stimulatory effects across whole-ecosystem scales. We suggest that existing efforts to predict carbon and nutrient cycling without considering virus effects are likely to miss essential features of marine food webs that regulate global biogeochemical cycles.


Figures

Figure 1
Figure 1
Schematic of the NPHZ-V model. (a) Interactions between populations and nutrients where arrows denote the flow of materials in the system. Note that decay processes are not depicted and the secondary effects on nutrients are depicted in (b). (b) Nutrient cycling in the system. Each of the different processes affect the levels of dissolved organic nitrogen (DON) and dissolved inorganic nitrogen (DIN), where the symbols ↑ or a ↓ denote whether a given process increases or decreases that particular pool, respectively.
Figure 2
Figure 2
Variation in model output via a Latin hybercube resampling (LHS) of parameter space. Parameter space for LHS analysis is documented in the Supplementary Information.
Figure 3
Figure 3
Distributions of community properties obtained via nonlinear optimization. The distribution correspond to the top 5% of model feature output (blue histogram) as compared with target values (red circle), along with the properties associated with the best ranking model replicate (green diamond). The number of cases (out of 218 top-performing model replicates) are noted on the y axis.
Figure 4
Figure 4
Comparison of steady-state concentrations with and without viruses. The colored lines denote contours of equal probability among 4366 model replicates (obtained via Latin hybercube sampling (LHS)) that yielded a coexistence equilibrium (see main text; histograms conducted in logarithmic space as input for contour analysis). The circles denote comparisons for the 218 model replicates identified as part of the targeted nonlinear optimization procedure (see main text). The red line denotes the 1:1 line. Comparisons to results without viruses are restricted to model results where C*> 0 with the exception of the comparison of eukaryotic autotrophs. In each panel, viruses increase/decrease the pool of interest, as compared with ecosystems without viruses, when points (or contours) lie above/below the red line.
Figure 5
Figure 5
Viral effects on community structure. The left panels (top and bottom) are stacked histograms of the concentration of nitrogen (N, in units of μM) partitioned in the different variables, H, C, E, Z, V (all types), xon and xin. The 218 stacked histograms correspond to each of the 218 parameter sets identified in the nonlinear optimization procedure described in the main text. The parameter sets were ordered based on the predicted total density of nitrogen (either organic or inorganic) at steady state within the specified variables. Hence, the top panel shows increasing total height. The 218 stacked histograms in the bottom-left panel show the expected average partitioning in ecosystems with the same parameters, although without viruses. The legend on the right includes information on both the color associated with each variable and the average concentration of N partitioned in that variable.
Figure 6
Figure 6
Ecosystem functioning effects of viruses, including (a) DON regeneration; (b) trophic transfer; (c) primary productivity; (d) cyanobacteria turnover rate. The contour lines represent the probability distribution of pairwise comparisons for the 4366 model replicates identified by Latin hybercube sampling (LHS; see main text). The circle denote comparisons for the 218 model replicates identified as part of the targeted nonlinear optimization procedure (see main text). The red line denotes the 1:1 line and contours provide information on the relative density of observed point pairs (histograms conducted in logarithmic space for two left panels and in linear space for two right panels as input for contour analysis). All axes denoting ecosystem fluxes are in units of μmol(l days) −1, whereas the axes for cyanobacterial turnover are in units of days.

References

    1. Allen LZ, Ishoey T, Novotny MA, McLean JS, Lasken RS, Williamson SJ. Single virus genomics: a new tool for virus discovery. PLoS One. 2011;6:e17722. - PMC - PubMed
    1. Ankrah NYD, May AL, Middleton JL, Jones DR, Hadden MK, Gooding JR, et al. Phage infection of an environmentally relevant marine bacterium alters host metabolism and lysate composition. ISME J. 2014;8:1089–1100. - PMC - PubMed
    1. Armstrong RA, McGehee R. Competitive exclusion. Am Nat. 1980;115:151–170.
    1. Barber RT, Marra J, Bidigare RC, Codispoti LA, Halpern D, Johnson Z, et al. Primary productivity and its regulation in the Arabian Sea during 1995. Deep Sea Res Part II: Top Stud Oceanogr. 2001;48:1127–1172.
    1. Baudoux A-C, Hendrix RW, Lander GC, Bailly X, Podell S, Paillard C, et al. Genomic and functional analysis of Vibrio phage SIO-2 reveals novel insights into ecology and evolution of marine siphoviruses. Environ Microbiol. 2012;14:2071–2086. - PMC - PubMed

Publication types