. 2015 Jan 30;10(1):e0117905.
doi: 10.1371/journal.pone.0117905. eCollection 2015.

Cortical structure of hallucal metatarsals and locomotor adaptations in hominoids

Affiliations

Cortical structure of hallucal metatarsals and locomotor adaptations in hominoids

Tea Jashashvili et al. PLoS One. .

Abstract

Diaphyseal morphology of long bones, in part, reflects in vivo loads experienced during the lifetime of an individual. The first metatarsal, as a cornerstone structure of the foot, presumably expresses diaphyseal morphology that reflects loading history of the foot during stance phase of gait. Human feet differ substantially from those of other apes in terms of loading histories when comparing the path of the center of pressure during stance phase, which reflects different weight transfer mechanisms. Here we use a novel approach for quantifying continuous thickness and cross-sectional geometric properties of long bones in order to test explicit hypotheses about loading histories and diaphyseal structure of adult chimpanzee, gorilla, and human first metatarsals. For each hallucal metatarsal, 17 cross sections were extracted at regularly-spaced intervals (2.5% length) between 25% and 65% length. Cortical thickness in cross sections was measured in one degree radially-arranged increments, while second moments of area were measured about neutral axes also in one degree radially-arranged increments. Standardized thicknesses and second moments of area were visualized using false color maps, while penalized discriminant analyses were used to evaluate quantitative species differences. Humans systematically exhibit the thinnest diaphyseal cortices, yet the greatest diaphyseal rigidities, particularly in dorsoplantar regions. Shifts in orientation of maximum second moments of area along the diaphysis also distinguish human hallucal metatarsals from those of chimpanzees and gorillas. Diaphyseal structure reflects different loading regimes, often in predictable ways, with human versus non-human differences probably resulting both from the use of arboreal substrates by non-human apes and by differing spatial relationships between hallux position and orientation of the substrate reaction resultant during stance. The novel morphological approach employed in this study offers the potential for transformative insights into form-function relationships in additional long bones, including those of extinct organisms (e.g., fossils).


Conflict of interest statement

Competing Interests: The authors have declared that no competing interests exist.

Figures

Fig 1
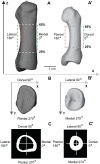
Fig 1. Protocol for positioning metatarsal renderings and extraction of cross sections.
A Human (dorsal view) and A’ Chimpanzee (lateral view): Landmarks positioned in centers of proximal (visible) and distal (not visible) articular surfaces were used to define the longitudinal axis of a diaphysis, which subsequently was aligned to the Z-axis in 3D space. Length refers to the distance between proximal and distal landmarks. Only the diaphyseal region between 25% and 65% length was investigated in the present analysis. Renderings (A and A’) illustrate broadly functionally equivalent positions of human and chimpanzee metatarsals during terrestrial locomotion, and thus the difference between functional and anatomical correspondence of cortices of the diaphysis. Specifically, and as explained in the method section (“Data Collection Protocol” subsection), the anatomical ML axis of chimpanzee (and gorilla) hallucal metatarsals is rotated internally 90 degrees, such that it becomes a ‘functional’ equivalent to the dorsoplantar axis of the human hallucal metatarsal. B Human and B’ Chimpanzee (proximal views): After aligning the longitudinal axis of a rendering to the Z-axis in 3D space, and while viewing the proximal articular surface, each rendering was rotated about its longitudinal axis until the sides of the grooved proximal articular surface paralleled the Y-axis in 3D space. C Human and C’ Chimpanzee: Cross section from 50% length of the rendering illustrated in A and 50% length of the rendering illustrated in A’. Note that in humans (C) 0 degrees corresponds to medial position on the diaphysis, 90 degrees to dorsal position, 180 degrees to lateral position, and 270 degrees to plantar position. In chimpanzees (and gorillas) (C’) 0 degrees corresponds to dorsal position on the diaphysis, 90 degrees to lateral position, 180 degrees to plantar position, and 270 degrees to medial position. Thus, functional comparisons between human and chimpanzee/gorilla hallucal metatarsal diaphyses compare the medial cortex in the former with the dorsal cortex in the latter, etc. See method section (“Data Collection Protocol” subsection) for additional explanation.
Fig 2
Fig 2. Quantifying and visualizing cortical bone thickness of hallucal metatarsals using false color maps.
A: Rendering of a human hallucal metatarsal illustrated after application of the position protocol. A total of 17 cross sections were extracted from each metatarsal in 2.5% length increments beginning at 25% (1) and ending at 65% length. B: Cortical thicknesses in the 17 cross sections (vertical axis) were mapped to a continuous range of colours. Cortical thickness along each of the 360 rays of a cross section was visualized from left to right (horizontal axis) beginning at 0 degrees (medial: M), and continuing through 90 (dorsal: D), 180 (lateral: L), and 270 degrees (plantar: P). Purple-colored pixels represent minimum thickness, while red-colored pixels represent maximum thickness. Second moments of area were calculated about neutral axes using the same 360 degree incremental protocol. Below the color map, an example of a cross section (25% length) is provided with cortical thicknesses measured from the centroid (i.e., yellow circle) to the periosteal surface along red lines located at 0, 90, 180, and 270 degrees (left to right, bottom). C: Measurements of cortical thickness at each of the 360 rays (e.g., left) cumulatively generate an overall thickness profile for the cross section (right). Illustrated measurements are in mm and are not standardized.
Fig 3
Fig 3. Comparisons of cortical bone thicknesses (CBTs).
Due to differences in configurations resulting from hallucal abduction in chimpanzees and gorillas (see Fig. 1), functionally equivalent cortices (columns in the color map) differ in anatomical correspondence (i.e., dorsal cortices of chimpanzee and gorilla hallucal metatarsals are comparable with medial cortices of human hallucal metatarsals, etc.). A: Distribution of standardized cortical thickness visualized for interspecific comparisons. The color scheme is mapped to cortical thickness measurements standardized by length, thus creating dimensionless values. Amongst all pixels in the species consensus maps, global minimum (0.02) and maximum (0.08) values were used to establish the same range against which each species map was illustrated. Color maps demonstrate variation between species (e.g., gorillas exhibit the highest standardized cortical thickness, while humans exhibit the lowest). B: Distribution of standardized cortical thickness visualized for intraspecific comparisons. The color scheme is mapped to cortical thickness measurements standardized by length, thus creating dimensionless values. Amongst all pixels in respective species consensus maps, global minimum and maximum values were used to establish species-specific ranges for visualizing each map. C: Distribution of coefficients of variation (CVs) of standardized cortical thickness for interspecific comparisons. Minimum and maximum CVs from the three species were used to establish the same range with which each individual species color map was illustrated. Each CV color map visualizes the range of variation expressed within the diaphysis of a species. M—medial, D—dorsal, L—lateral, P—plantar.
Fig 4
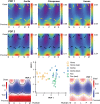
Fig 4. Penalized discriminant analysis (PDA) of standardized cortical bone thicknesses (CBTs).
Due to differences in configurations resulting from hallucal abduction in chimpanzees and gorillas (see Fig. 1), functionally equivalent cortices (columns in the color map) differ in anatomical correspondence (i.e., dorsal cortices of chimpanzee and gorilla hallucal metatarsals are comparable with medial cortices of human hallucal metatarsals, etc.). Rows of color maps along the top (PDF1 and PDF2) visualize the distribution of mean scaled CBT for interspecific comparisons. In the uppermost row (PDF1), boundaries (dashed yellow lines) superimposed on consensus maps (see Fig. 3A) differentiate pixels with positive loading (red) from those with negative loading (blue) on PDF1. A positive loading for a given pixel indicates that a larger CBT value at that pixel increases the relative score on that discriminant axis. Similarly, a negative loading for a given pixel indicates that a larger CBT value at that pixel decreases the relative score on that discriminant axis. In the middle row (PDF2), boundaries (dashed black lines) superimposed on the same consensus maps differentiate pixels with positive loading (red) from those with negative loading (blue) for PDF2. Along the bottom, color maps (far left and far right in a red-blue colour scale) visualize pixel-wise loadings of 1st and 2nd penalized discriminant functions (PDF1 on the right and plotted on the horizontal axis of the centre scatter plot; PDF2 on the left and plotted on the vertical axis of the centre scatter plot). Note that white indicates the transition between positive and negative loadings (i.e., 0 loading by default). The bivariate scatter plot (bottom centre) presents the projection of each individual in the sample (n = 43; open symbols) into discriminant space via PDF1 and PDF2. Circles in the scatter plot indicate species means in discriminant space, effectively indicating group separation. Squares indicate subjects used in the training sample. Stars indicate test subjects. See the methods for an explanation of training versus test subjects. M—medial, D—dorsal, L—lateral, P—plantar.
Fig 5
Fig 5. Comparisons of second moments of area (SMAs).
Due to differences in configurations resulting from hallucal abduction in chimpanzees and gorillas (see Fig. 1), functionally equivalent cortices (columns in the color map) differ in anatomical correspondence (i.e., dorsal cortices of chimpanzee and gorilla hallucal metatarsals are comparable with medial cortices of human hallucal metatarsals, etc.). A: Distribution of standardized SMAs visualized for interspecific comparisons. The color scheme is mapped to SMAs standardized by the product of length and estimated body mass, creating mm3/kg values. Amongst all pixels in the species consensus maps, global minimum (0.87) and maximum (6.45) values were used to establish the same range against which each species map was illustrated. Color maps demonstrate variation between species (e.g., humans exhibit the highest standardized SMAs, while chimpanzees exhibit the lowest). B: Distribution of standardized SMAs visualized for intraspecific comparisons. The color scheme is mapped to SMAs standardized by the product of length and estimated body mass, creating mm3/kg values. Amongst all pixels in respective species consensus maps, global minimum and maximum values were used to establish species-specific ranges for visualizing each map. C: Distribution of coefficients of variation (CVs) of standardized SMAs for interspecific comparisons. Minimum and maximum CVs from the three species were used to establish the same range with which each individual species color map was illustrated. Each CV color map visualizes the range of variation expressed within the diaphysis of a species. M—medial, D—dorsal, L—lateral, P—plantar.
Fig 6
Fig 6. Penalized discriminant analysis (PDA) of standardized second moments of area (SMAs).
Due to differences in configurations resulting from hallucal abduction in chimpanzees and gorillas (see Fig. 1), functionally equivalent cortices (columns in the color map) differ in anatomical correspondence (i.e., dorsal cortices of chimpanzee and gorilla hallucal metatarsals are comparable with medial cortices of human hallucal metatarsals, etc.). Rows of colour maps along the top (PDF1 and PDF2) visualize the distribution of mean scaled SMA for interspecific comparisons. In the uppermost row (PDF1), the boundaries (dashed yellow lines) superimposed on consensus maps (see Fig. 5A) differentiate pixels with positive loading (red) from those with negative loading (blue) on PDF1. A positive loading for a given pixel indicates that a larger SMA value at that pixel increases the relative score on that discriminant axis. Similarly, a negative loading for a given pixel indicates that a larger SMA value at that pixel decreases the relative score on that discriminant axis. In the middle row (PDF2), boundaries (dashed black lines) superimposed on the same consensus maps differentiate pixels with positive loading (red) from those with negative loading (blue) for PDF2. Along the bottom, color maps (far left and far right in a red-blue color scale) visualize pixel-wise loadings of 1st and 2nd penalized discriminant functions (PDF1 on the right and plotted on the horizontal axis of the centre scatter plot; PDF2 on the left and plotted on the vertical axis of centre scatter plot). Note that white indicates the transition between positive and negative loadings (i.e., 0 loading by default). The bivariate scatter plot (bottom centre) presents the projection of each individual in the sample (n = 43; open symbols) into discriminant space via PDF1 and PDF2. Circles in the scatter plot indicate species means in discriminant space, effectively indicating group separation. Squares indicate subjects used in the training sample. Stars indicate test subjects. See the methods for an explanation of training versus test subjects. M—medial, D—dorsal, L—lateral, P—plantar.

Similar articles

Cited by

References

    1. Gebo DL, Schwartz GT (2006) Foot bones from Omo: Implications for hominid evolution. Am J Phys Anthropol 129: 499–511. - PubMed
    1. Lewis OJ (1989) Functional morphology of the evolving hand and foot. Oxford: Clarendon Press;
    1. Gebo DL (1993) Functional morphology of the foot of primates In: Gebo D. L., editor editors. Postcranial adaptations in nonhuman primates. Dekalb: Northern Illinois University Press; pp. 175–198.
    1. Stern JT, Susman RL (1983) The locomotor anatomy of Australopithecus afarensis . Am J Phys Anthropol 60: 279–317. - PubMed
    1. Elftman H, Manter JT (1935) The evolution of the human foot, with especial reference to the joints. J Anat 70: 56–67. - PMC - PubMed

Publication types

LinkOut - more resources