. 2015 Jan 30;10(1):e0117522.
doi: 10.1371/journal.pone.0117522. eCollection 2015.

YAP regulates S-phase entry in endothelial cells

Affiliations

YAP regulates S-phase entry in endothelial cells

Zhewei Shen et al. PLoS One. .

Abstract

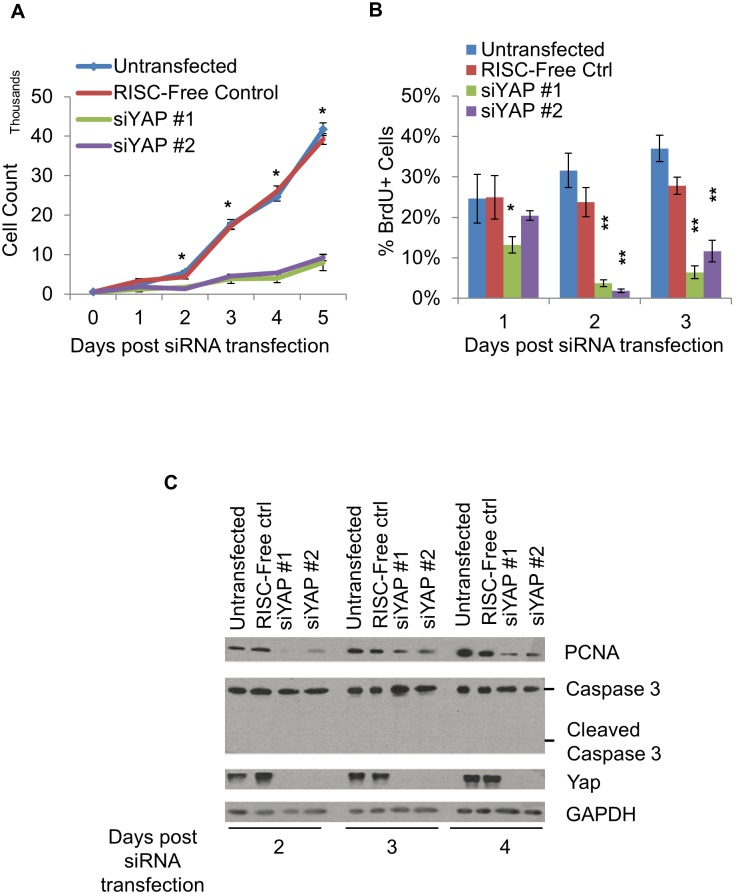
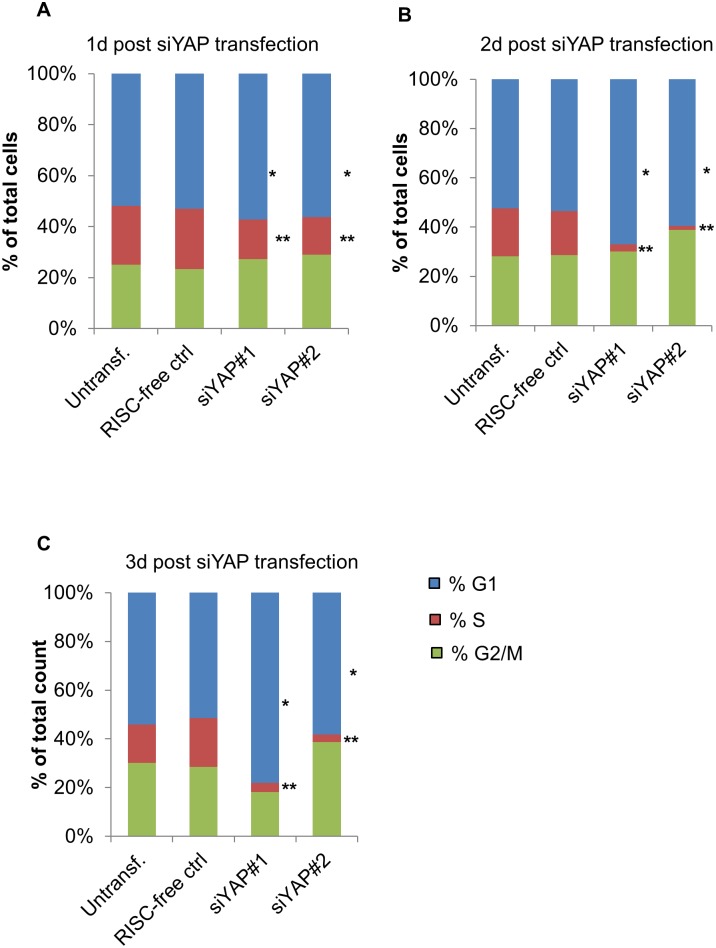
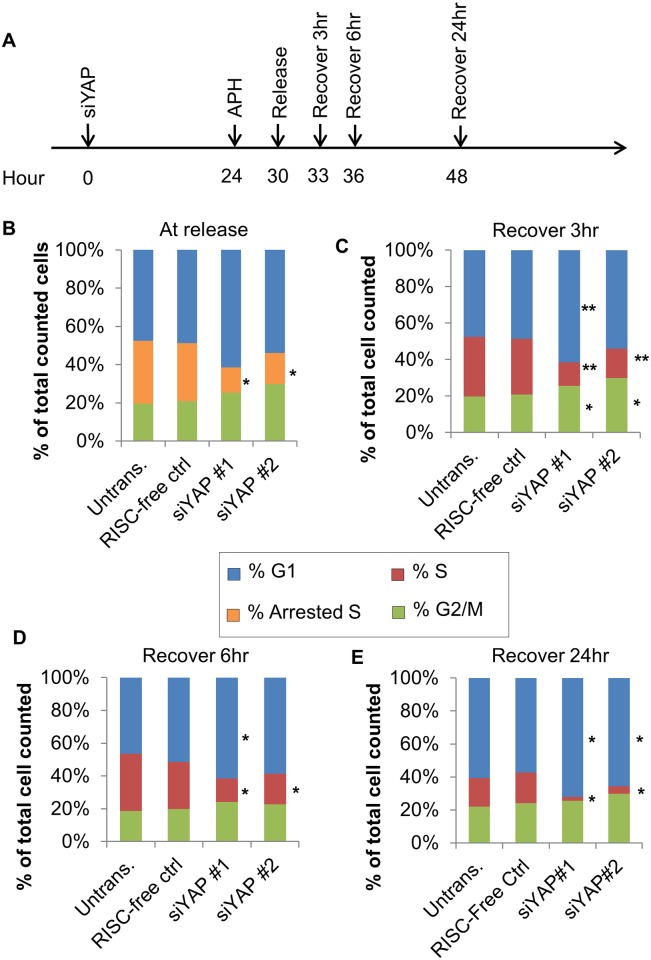
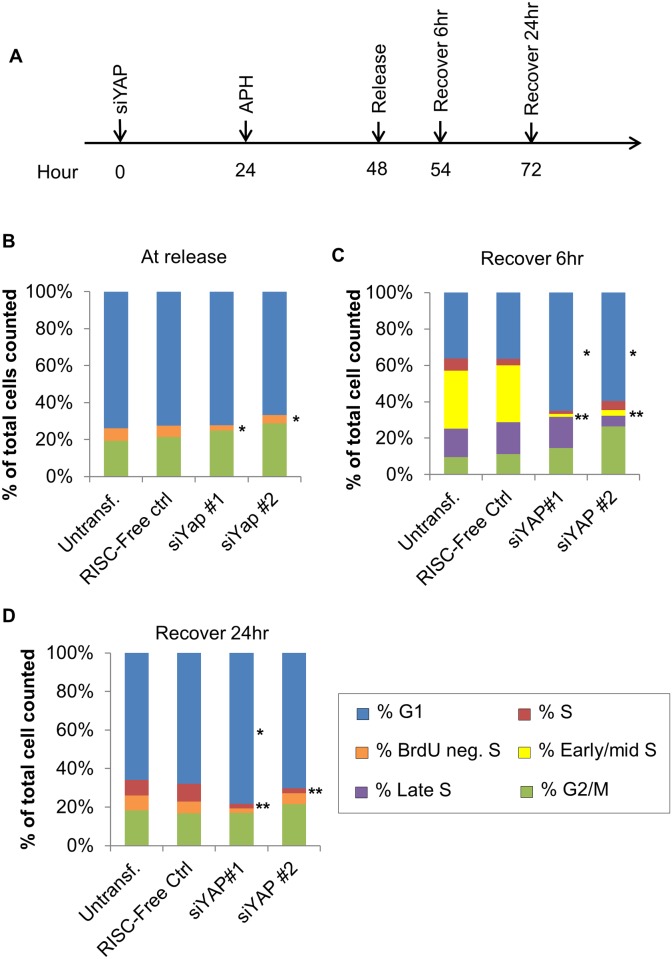
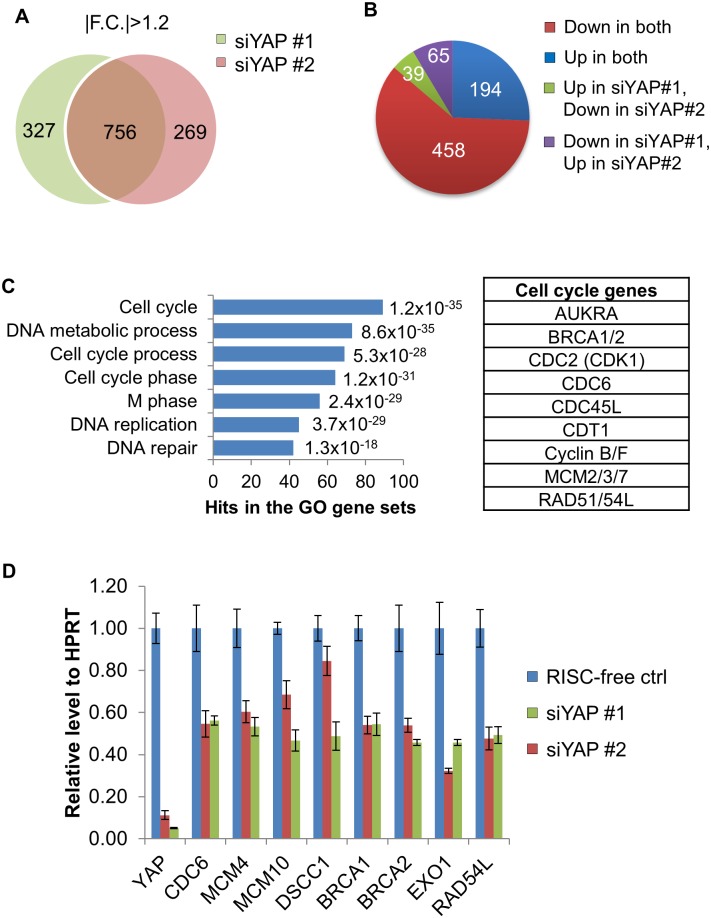
The Hippo pathway regulates cell proliferation and apoptosis through the Yes-associated protein (YAP) transcriptional activator. YAP has a well-described role in promoting cell proliferation and survival, but the precise mechanisms and transcriptional targets that underlie these properties are still unclear and likely context-dependent. We found, using siRNA-mediated knockdown, that YAP is required for proliferation in endothelial cells but not HeLa cells. Specifically, YAP is required for S-phase entry and its absence causes cells to accumulate in G1. Microarray analysis suggests that YAP mediates this effect by regulating the transcription of genes involved in the assembly and/or firing of replication origins and homologous recombination of DNA. These findings thus provide insight into the molecular mechanisms by which YAP regulates cell cycle progression.


Conflict of interest statement

Competing Interests: The authors have declared that no competing interests exist.

Figures

Fig 1
Fig 1. Deletion of YAP results in decreased HUVEC cell number.
A. HUVEC cell number plotted against time after siRNA transfection. Untransfected and RISC-free siRNA were the control groups. Cells were counted on an Accuri C6 flow cytometer at 24 h intervals after transfection. There was a significant decrease in cell number in siYAP treated HUVECs compared to control HUVECs 48 h post-knockdown and at later time-points. Data are plotted as mean +/- standard error. N = 3 for each timepoint; *, p < 0.001. B. Quantification of BrdU+ HUVECs upon siYAP transfection. Cells were incubated with BrdU for 30 min and then stained with a BrdU antibody for visualization and quantification (plotted as the ratio of BrdU+ cells as a percent of total cells counted). Significantly fewer BrdU+ HUVECs were detected in siYAP-treated cells. Error bars indicate standard errors. P-values reflect differences compared to RISC-free control. *, p < 0.04; **, p < 0.007. C. Immunoblot (IB) assessing the levels of PCNA, CASPASE3, cleavage CASPASE3 in control and YAP knockdown (YAP-KD) cells. Protein samples were collected on d 1, 2 or 3 post-siRNA transfection and analyzed by western blot. No CASPASE3 cleavage was detected on d 2, 3 or 4, suggesting that YAP knockdown did not affect cell survival. See also S1 and S2 Figs.
Fig 2
Fig 2. Yap knockdown in HUVECs results in G1 accumulation.
A. Quantitative comparisons of cell cycle profiles comparing control and YAP-KD cells 1 d after siRNA transfection. Cells were incubated with BrdU for 1 hour and then stained for BrdU followed by FACS analysis. Data are plotted as the percentage of cells in each stage of the cell cycle (see S3 Fig.). HUVECs treated with siYAP exhibited a significant decrease in S-phase and increase in G1-phase at this time point. p-values were calculated by comparing each phase to the corresponding datasets from RISC-free control. *, p < 0.04; **, p < 0.007. B. Quantitative comparisons of cell cycle profiles between control and YAP-KD cells 2 d after siRNA transfection. Cells were processed and the data examined statistically as described in (A). *, p < 0.04; **, p < 0.007. C. Quantitative comparisons of cell cycle profiles between control and YAP-KD cells 3 d after siRNA transfection. Cells were processed and the data examined statistically as described in (A). *, p < 0.04; **, p < 0.007. See also S3 and S4 Figs.
Fig 3
Fig 3. Yap is not required for S-phase progression in HUVECs.
A. Schematic of the APH experiment. HUVECs were treated with siRNA for 24 hours then incubated with 5µM APH for 6 h. HUVECs were collected at 3, 6, or 24 h post-APH removal, receiving a pulse of BrdU at the time of harvest. B. Quantification of cell cycle profiles comparing control and YAP-KD cells after 6 h APH arrest (“Release”). All HUVECs exhibited S-phase stall upon APH treatment (orange bars). Significantly fewer S-phase cells were detected in siYAP-treated HUVECs. p-values were calculated by comparing each phase to the corresponding datasets from RISC-free control. *, p < 0.04. C. Quantification of cell cycle profiles comparing control and YAP-KD cells 3 hours after APH removal. All HUVECs, including siYAP-transfected cells, reinitiated S-phase with similar kinetics. p-values were calculated as described in (B). *, p < 0.04; **, p < 0.007. D. Quantification of cell cycle profiles comparing control and YAP-KD cells 6 h after APH removal. HUVECs with siYAP transfection could restart stalled S-phase in a YAP-independent manner. p-values were calculated as described in (B). *, p < 0.04. E. Quantification of cell cycle profiles comparing control and YAP-KD cells 24 h after APH removal. Normal cell cycle profiles were re-established in control cells while the YAP-KD cells had fewer S-phase cells, suggesting that S-phase progression is YAP independent. p-values were calculated as described in (B). *, p < 0.007. See also S5 Fig.
Fig 4
Fig 4. Yap is required for S-phase entry in HUVECs.
A. Schematic of the APH experiment. HUVECs were treated with siRNA for 24 h then incubated with 5µM APH for 24 h. BrdU-treated HUVECs were collected at 3, 6, or 24 h post-APH removal. B. Quantification of cell cycle profiles comparing control and YAP-KD cells at the end of the 24 h APH arrest. Most of the cells captured by FACS were BrdU negative and had DNA contents of either 2N or 4N (reflecting arrest predominantly in G1 and G2/M). siYAP treatment under these conditions resulted in a further decrease of S-phase cells. p-values were calculated by comparing each phase to the corresponding datasets from RISC-free control. *, p < 0.04. C. Quantification of BrdU FACS cell cycle analysis 6 h after APH removal. Control cells were able to initiate S-phase indicated by “early S” cells. However, this population of cells was significantly reduced in siYAP-transfected cells. p-values were calculated as described in (B). * (blue bar, compared to the controls), p < 0.04. ** (yellow bar, compared to the controls), p< 0.007. D. Quantification of BrdU FACS cell cycle analysis 24 h after APH removal. siYAP-treated cells continued to exhibit decreased numbers of S-phase cells after 24 h of APH recovery. p-values were calculated as described in (B). * (blue bar, compared to the controls), p < 0.04; ** (red bar, compared to the controls), p < 0.007. See also S6 Fig.
Fig 5
Fig 5. YAP regulates the expressions of factors critical for replication origin biology and homologous recombination.
A. Venn diagram comparing microarray analysis results from HUVECs treated with either siYAP#1 or siYAP#2 for 30 h. Candidate genes with expression fold change of 1.2 or more, a p-value less than 0.05, and a false discovery rate (FDR) of less than 0.1 were used. 756 genes were common hits for the siRNA transfected cells, a number that corresponds to approximately 70% of the genes that exhibited expression changes with either siRNA. Fold changes were calculated using RISC-free control line as the reference group. Each condition contains four biological replicates (N = 4). B. Pie chart analysis of the 756 genes from (A). “Up” and “down” represent the directionality of expression changes of each gene in siYAP #1 or #2 treated HUVEC. Most of the 756 genes were down-regulated with both siRNAs (red group). Approximately 25% of genes were up-regulated with both siRNAs (blue group), while 14% showing discordant directionality of change (green and purple groups). C. DAVID bioinformatics gene ontology analysis of the top 8 hits/pathways within the red group from (B). The number of hits in each matching gene ontology group is graphed on the X-axis, with weighed p-values listed next to each histogram. Representative candidate genes with major roles in cell cycle regulation identified in the ontology analysis were listed in the “Cell cycle genes” table. D. RT-PCR validation of the microarray results. All candidates except DSCC1 exhibited significant expression changes in siYAP#1- and siYAP#2-treated cells. Transcript abundance was calculated by normalizing each measurement to an HPRT control. See also S7 and S8 Figs.

References

    1. Harvey K, Tapon N (2007) The Salvador-Warts-Hippo pathway—an emerging tumour-suppressor network. Nat Rev 7: 182–191. 10.1038/nrc2070 - DOI - PubMed
    1. Saucedo LJ, Edgar BA (2007) Filling out the Hippo pathway. Nat Rev cell Biol 8: 613–621. 10.1038/nrm2221 - DOI - PubMed
    1. Pan D (2007) Hippo signaling in organ size control. Genes Dev 21: 886–897. 10.1101/gad.1536007 - DOI - PubMed
    1. Zhao B, Ye X, Yu JJ, Li L, Li W, et al. (2008) TEAD mediates YAP-dependent gene induction and growth control. Genes Dev 22: 1962–1971. 10.1101/gad.1664408.2007 - DOI - PMC - PubMed
    1. Ota M, Sasaki H (2008) Mammalian Tead proteins regulate cell proliferation and contact inhibition as transcriptional mediators of Hippo signaling. Development 135: 4059–4069. 10.1242/dev.027151 - DOI - PubMed

Publication types

Associated data