. 2015 Jan 30:6:6170.
doi: 10.1038/ncomms7170.

NR2F1 controls tumour cell dormancy via SOX9- and RARβ-driven quiescence programmes

Affiliations

NR2F1 controls tumour cell dormancy via SOX9- and RARβ-driven quiescence programmes

Maria Soledad Sosa et al. Nat Commun. .

Abstract

Metastases can originate from disseminated tumour cells (DTCs), which may be dormant for years before reactivation. Here we find that the orphan nuclear receptor NR2F1 is epigenetically upregulated in experimental head and neck squamous cell carcinoma (HNSCC) dormancy models and in DTCs from prostate cancer patients carrying dormant disease for 7-18 years. NR2F1-dependent dormancy is recapitulated by a co-treatment with the DNA-demethylating agent 5-Aza-C and retinoic acid across various cancer types. NR2F1-induced quiescence is dependent on SOX9, RARβ and CDK inhibitors. Intriguingly, NR2F1 induces global chromatin repression and the pluripotency gene NANOG, which contributes to dormancy of DTCs in the bone marrow. When NR2F1 is blocked in vivo, growth arrest or survival of dormant DTCs is interrupted in different organs. We conclude that NR2F1 is a critical node in dormancy induction and maintenance by integrating epigenetic programmes of quiescence and survival in DTCs.


Conflict of interest statement

Conflict of interest. The authors declare no competing financial interests..

Figures

Figure 1
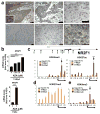
Figure 1. a) NR2F1 and RA responsive genes in quiescent HEp3 cells
Upper panel: RNA from sorted GFP-positive T-HEp3 (proliferative) and D-HEp3 (quiescent) cells grown in CAMs for 7 days was expression profiled using the Affymetrix platform. The heat map shows the Log2-fold mRNA level change normalized to the levels in proliferative HEp3 cells. Tumors (n=5) were collected and RNA pooled and run in triplicate Affymetrix HG-U133-PLUS2 arrays. Lower panel: QPCR for NR2F1 (T-HEp3 tumors n=12, D-HEp3 tumors n=15) and RARβ2 (T-HEp3 tumors n=9, D-HEp3 tumors n=6) mRNA in T- and D-HEp3 cells grown in CAMs for 7 day. b) IHC for NR2F1. Upper panels, T-HEp3 tumors and D-HEp3 nodules sectioned and stained by IHC against NR2F1. Insets = higher magnification of replicate T- or D-HEp3 tumors. Bars = 50 um. Lower left panel: QPCR for NR2F1 mRNA in D= D-HEp3, T= T-HEp3, SQ= SQ20B, F= FaDu cells in the presence or absence of 10% FBS. n=3 RNA replicates/condition. Lower right panel: Nuclear fraction lysates of the indicated cell lines IB for NR2F1. LaminB1 = loading control. 3 independent experiments. Bars = 50 μm. c) Single-cell expression profiling on bone marrow DTCs. Left panel: BM DTCS were isolated from patients with No Evidence of Disease (NED, n=4 patients) and patient with advanced disease (ADV, n=6 patients). Single-cell gene expressions were analyzed by Agilent 4×44K Human Microarrays and NR2F1 and TGFβ2 mRNA levels were compared between both groups. Right panel: Percentage of DTCs with high levels of NR2F1 mRNA levels were plotted for NED patients or ADV patients. n= number of DTCs. p values were obtained by Mann-Whitney test. d) NR2F1 function in D-HEp3 cell dormancy. Left panel: Control, NR2F1- or p38α-depleted D-HEp3 cells were inoculated into CAMs and 4 days later the total tumor cells were counted. Right panel: IHC for Ki67 in siControl or siNR2F1 tumor sections. n=5 tumors/group. e) QPCR for HES1, p27, p16, p15 and cyclinD1 genes from siControl or siNR2F1 tumor RNA samples. Unless stated all data are representative of at least triplicate independent experiments, n=3 RNA replicates/condition unpaired t test, *p<0.05, ***p<0.0005, SD shown. Mann-Whitney test was used for in vivo experiments.
Figure 2
Figure 2. NR2F1 expression in HNSCC tumors and epigenetic regulation
a) NR2F1 protein detection in benign adjacent oral mucosa (Inset= magnification of NR2F1+ epithelium), in primary tumors (PT) and lymph node metastasis (met). Bars = 50 μm. Images shown are representative of n= 6 benign adjacent tissue, 15 primary tumors, 9 recurrences and 11 metastasis. b) Azacytidine treatment and NR2F1 expression in HNSCC cells. T-HEp3 (top panel) and FaDu (lower panel) cells were treated with 5-azacytidine (AZA) at the indicated concentrations for 2 days and NR2F1 mRNA quantified by QPCR. Y axis= AZA conditions over no AZA. ***=p<0.0005, unpaired t test. n=3 RNA samples/condition. c–d) H3PTMs at the NR2F1 locus in T- and D-HEp3 cells. T- and D-HEp3 cells were cultured in vitro followed by ChIP-qPCR analysis of the NR2F1 genomic locus for H3K4me3, H3K27ac (c) and H3K27me3 (d) histone modifications. Top scheme shows the primers used around the transcription start site (TSS) of the NR2F1 genomic locus. Bar graphs indicate fold enrichment over Input (1%), *p<0.05, **p<0.005, unpaired t test, mean ± s.d. (n=3). Arrows show sites with significant changes for the indicated histone modification in two independent experiments. All other data are representative of at least triplicate independent experiments. e) ChIP-qPCR for H3k4me3 at the NR2F1 locus in D-HEp3 cells. After NR2F1 ablation (by siRNA, 50 nM) cultured cells were subjected to ChIP-qPCR for H3K4me3 at NR2F1 locus. Arrows show sites with significant changes for the indicated histone modification in two independent experiments. *p<0.05, unpaired t test, mean ± SD (n=3). All other data are representative of at least triplicate independent experiments, SD shown.
Figure 3
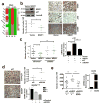
Figure 3. a) Identification of NR2F1 and RARβ targets
Heat map for the 10 genes that share NR2F1 and RARβ binding elements. Log2 gene expression changes, green= basal expression in Proliferative (P) T-HEp3 cells and increasing red intensity indicates upregulation in quiescent (Q) D-HEp3 cells. b) Overexpression of NRF21 inhibits tumor growth. NR2F1, p27 and Lamin-B detection in T-HEp3 cells transfected with NR2F1 or Control plasmids (top left panels) or tested for tumor growth on CAMs for 5 days (bottom left panel). n=4 tumors/group. IHC on vector or NR2F1-overexpressing tumor sections for the indicated antigens (right panels). Scale bars: 50 μm. c) NR2F1 inhibits tumor growth via SOX9. Left panel: T-HEp3 cells transfected with SOX9 or control siRNAs (50 nM) were re-transfected with empty or NR2F1 cDNA vectors. Tumor growth was quantified 4 days later on CAMs; 3 independent experiments (left panel). Vector, n=13 tumors; siC NR2F1, n=15 tumors; siSOX9 vector, n= 8 tumors; siSOX9 NR2F1, n=10 tumors. Right panel: p16 mRNA levels relative to tubulin in T-HEp3 cells in the indicated groups. d) SOX9 RNAi promotes D-HEp3 cell proliferation. D-HEp3 cells were transfected with siRNA for SOX9 or control (siC, 50 nM). Left: Tumor sections from siControl and siSOX9 groups stained for p27 by IHC. Top right: growth of siControl or siSOX9-treated D-HEp3 cells on CAMs for 4 days. Bottom right: mRNA levels for p27 and p16 after 4 days in vivo. n= 5 tumors/group. Scale bars: 50 μm. e) SOX9 overexpression blocks dormancy reactivation after NR2F1 RNAi. Left panel: D-HEp3 cells were transfected with NR2F1 or control siRNAs (50 nM) and then transfected with SOX9 cDNA or empty vector. Growth of these groups was assessed on CAMs for 4 days. 2 independent experiments. Right panel: D-HEp3 cells were transfected with SOX9 cDNA or empty vector. SOX9 mRNA levels were measured by QPCR. siC vector n=10 tumors; siNR2F1 vector, n=11 tumors; siNR2F1 SOX9 n= 11 tumors. Unless stated all data are representative of at least triplicate independent experiments, n=3 RNA replicates/condition unpaired t test, *p<0.05, ***p<0.0005, SD shown. Mann-Whitney test was used for in vivo experiments.
Figure 4
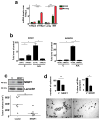
Figure 4. AzaC+atRA and NR2F1-induced reprogramming
a) T-HEp3 cells treated with 5 nM of AzaC or PBS for 48 hrs. in media + charcolized serum were washed and stimulated with atRA (2 μM) or DMSO for 48hs in serum-free media. NR2F1, RARβ and SOX9 mRNA levels measured by QPCR. *p<0.05. b) T-HEp3 cells were treated as in (a). Then, cells were grown in DMEM 10% FBS for 3 days without drugs and RARβ mRNA levels measured by QPCR. Pre-reprogramming=4 days of Aza+atRA treatment (see Supplementary Fig. 4f); post-reprogramming= 3 days after Aza+atRA treatment. *p<0.05 c) NR2F1, RARβ and SOX9 mRNA levels in T-HEp3 cells transfected with siControl or siNR2F1 (50 nM) treated as in (a) and left untreated for 3 days. *p<0.05. d) T-HEp3 cells were stimulated with atRA (2μM) or DMSO inoculated on CAMs (150×103/animal), and tumor growth scored at day 4. n=4, *p<0.05. e) Sections from tumors treated as in (d) were probed for RARβ mRNA levels or stained for the indicated antigens. ***p<0.0005. Scale bars:15 and 75 μm. f) T-HEp3 cells transfected with siRNAs for NR2F1, SOX9 or control were stimulated with atRA (2μM) or DMSO and then inoculated into CAMs (1.5×10⁵ cells/embryo) as in (d). *p<0.05. siC DMSO group, n=3 tumors; siC atRA group, n=5 tumors; siNR2F1 atRA group, n=5 tumors; siSOX9 atRA group, n=4 tumors. g) Quantification (left) of H2B-GFP label retaining T-HEp3 cells in vivo after treatment as in (a) except that 3 days before the treatment cells were induced with doxycycline to induce H2B-GFP; ***p<0.0001. Right: phase contrast (top) and GFP channel (bottom) images of H2B-GFP tumor explants after gentle mechanical mincing. Unless stated all data are representative of at least triplicate independent experiments. y=percentage of positive green cells in 4 fields. n=6 tumors per group. Scale bars: 45 μm. Unless stated all data are representative of at least triplicate independent experiments, n=3 RNA replicates/condition unpaired t test, SD shown. Mann-Whitney test was used for in vivo experiments.
Figure 5
Figure 5. NR2F1 and tumor initiating properties
a) Expression of SOX2 and NANOG in proliferative vs. dormant HEp3 sublines. Cells were grown in complete medium and RNA was extracted and converted to cDNA. SOX2 and NANOG mRNA levels were measured by QPCR. ***p<0.0005, *p<0.05, **p<0.005, unpaired t test. Lung: a line derived from HEp3 lung DTCs (proliferative). BM: a line derived from HEp3 BM DTCs (dormant). b) AzaC+atRA treatment requires NR2F1 to induce SOX2 and NANOG. T-HEp3 cells treated with AzaC+atRA or PBS/DMSO were transfected with siControl or siNR2F1 and SOX2 and NANOG mRNAs were detected by QPCR. c) NR2F1 inhibits MMTV-Myc tumorsphere formation capacity. MMTV-myc cells stably expressing a control or murine NR2F1 cDNA were inoculated orthotopically in syngeneic FvB mouse (1000 cells/mouse). Tumor size was measured daily and the final tumor size is shown. In all panels experiments were performed a minimum of two times. V=vector, *p<0.05, unpaired t test. N=6 per condition, y=tumor volume. d) Same cells as c) were cultured in mammospheres conditions and quantified (top left) and 8 days later cells were analyzed by FACS for CD29 and CD24 markers (top right), quantified and imaged (bottom left and right). Pictures show MMTV-myc mammoespheres. V=vector, ***p<0.0005, unpaired t test. n=3 wells per condition, y=number of spheres per conditions. Scale bars= 200 μm. Unless stated all data are representative of at least triplicate independent experiments and QPCR: n=3 RNA replicates/condition, SD shown. Mann-Whitney test was used for in vivo experiments.
Figure 6
Figure 6. NR2F1 and global H3-PTMs
a) H3K27me3 and H3K9me3 levels in T- and D-HEp3 cells. D-HEp3 and T-HEp3 cells grown on coverslips were fixed with 4% PFA and stained with anti-H3K27me3 and -H3K9me3 antibodies (left panels); representative images are shown. Quantification (right panel) was performed after setting up fixed arbitrary units of immunoflourescence intensity. High mean intensity (MIF) fluorescence was scored using Metamorph for each group. ***p<0.0005, unpaired t test. Scale bars: 40 μm. b) Effect of AzaC+atRa treatment on H3K27me3 and H3K9me3 levels. T-HEp3 cells grown in vitro were treated with AzaC+atRA or PBS/DMSO as described in Fig. 4a were stained for the indicated markers and percent of high MFI cells scored.*p<0.05, unpaired t test. c) AzaC+atRa treatment renders T-HEp3 cells [H3K27me3/H3K9me3/NR2F1/SOX9]highin vivo. T-HEp3 cells were treated with AzaC+atRa as described in Supplementary Fig. 4f and 1 day after washout cells were inoculated into CAMs (150×103 cells/embryo). One-week later tumors were collected and histological sections were stained by IHC using the indicated antibodies. Scale bars, 50 μm. Insets show higher magnification views. Scale bars: 50 μm, insets= 15 μm. d) NR2F1 is required to induce high H3K9me3 and H3K27me3 levels after AzaC+atRa treatment. T-HEp3 cells were transfected with siControl or siNR2F1 and then treated with AzaC+atRA or PBS/DMSO as described in Supplementary Fig. 4f. 3 days after reprogramming cells were fixed and stained for the indicated markers. ***p<0.0005, **p<0.005, *p<0.05, unpaired t test. Unless stated all data are representative of at least triplicate independent experiments, SD. For a, b and d, n=200 cells, y=percentage of cells with high MIF.
Figure 7
Figure 7. Effect of NR2F1 knockdown on loco-regional and distant recurrences
a) Upper panels: Tet-ON inducible shRNAmir-NR2F1 T-HEp3 cells s.c. tumors that reached ~800 mm3 in nude mice were surgically removed and mice were treated with (25 mg/kg DOX, every 48 hrs., n=15) or without (N=12, middle panel) DOX (right panel). Flat green or red lines on the x-axis are all animals without recurrences. Lower left panel: skin sections in surgery margins (48 hrs. after surgeries) were analyzed by IF. T-HEp3 cells were identified by vimentin staining (green). NR2F1, SOX9 and P-H3 (red) were stained with specific antibodies. Graph = % of positive cells for each marker per field. TM=tumor mass, RTCs: single residual tumor cells, n=total # of cells counted in 2–5 animals. The lower right panel shows representative pictures for each antigen. Inset: higher magnification of cells in the red channel (gray scale pseudo color). TM, n=3 animals, RTCs, n=3 animals; for SOX9: TM, n=3 animals, RTCs, n=5 animals; for P-H3: TM, n=2 animals, RTCs, n=3 animals. Bars: 10 μm. b) NR2F1 knockdown and AzaC+atRA(A/A)-induced dormancy. T-HEp3 cells treated in vitro with PBS/DMSO (c= control) or A/A treatment were inoculated into nude mice (n=5) and then treated as in (a); 12 days later tumor growth was measured. *p<0.05, unpaired t test. c) Effect of NR2F1 knockdown on spleen DTCs. DTCs isolated from spleen of the same animals in (a) were detected by Alu-QPCR as described Mann Whitney test p<0.05. SPLEN DTCs: n=14 mice control, n=11 mice shNR2F1, y=ct values in triplicate per mice. d) Effect of NR2F1 knockdown on lung DTCs. The same animals in (a) were used to detect DTCs from lung by Alu-QPCR. Mann Whitney test p<0.05. lung DCTS: n=11 mice control, n=14 mice shNR2F1,y=ct values in triplicate per mice. e) Effect of NR2F1 knockdown on BM DTCs. BM aspirates from same animals in (a) were used to detect BM DTCs by Alu-QPCR. Mann Whitney test p<0.05. BM DTCs: n=10 mice control, n=12 mice shNR2F1 y=ct values in triplicate per mice. Unless stated all data are representative of at least duplicate independent experiments, SD.
Figure 8
Figure 8. Integrative scheme of NR2F1 functions and the regulation of DTC fate
DTCs that arrive to specific microenvironments (e.g. lung, bone marrow) might integrate stress signals imposed by dissemination (p38α/β activation), by the new microenvironment and growth restrictive signals that maintain normal organ function (atRA+p38α/β activation). These signals jointly result in NR2F1 upregulation, which can in turn induce a quiescence program via the induction of CDK inhibitors (i.e. p16). This is executed by another set of TFs that include at least SOX9 and RARβ. In lung, spleen and surgery margins, the NR2F1-regulated quiescence program seems to be important to maintain dormancy, while in the bone marrow NR2F1 appeared to primarily regulate survival of DTCs. NR2F1 was also found to regulate the expression of two key pluripotency genes, NANOG and SOX2. A division of labor between NANOG and NR2F1 occurs in BM DTCs where growth arrest signals are regulated by NANOG while survival pathways are subjected to NRF21 functions. The ability of NR2F1 to coordinate these programs long-term may be due to its ability to generate global changes in histone H3 PTMs. atRA also regulates the induction of TGFβ2 in malignant cells that further induces signals in the dormancy program by inducing DEC2 via canonical and non canonical TGFβ2 signaling; this is independent of NR2F1. Finally, the dormancy program may be manipulated to favor dormancy maintenance using 5-Aza-C combined with atRA as an epigenetic therapy. This reprogramming protocol may also be used to study how dormant cells survive in quiescence and design anti-survival therapies that target quiescent DTCs.

References

    1. Sosa MS, Avivar-Valderas A, Bragado P, Wen HC, Aguirre-Ghiso JA. ERK1/2 and p38alpha/beta signaling in tumor cell quiescence: opportunities to control dormant residual disease. Clin Cancer Res. 2011;17:5850–5857. - PMC - PubMed
    1. Sosa MS, Bragado P, Aguirre-Ghiso JA. Mechanisms of disseminated cancer cell dormancy: an awakening field. Nature reviews Cancer. 2014;14:611–622. - PMC - PubMed
    1. Adam AP, et al. Computational identification of a p38SAPK-regulated transcription factor network required for tumor cell quiescence. Cancer Res. 2009;69:5664–5672. - PMC - PubMed
    1. Onder TT, et al. Chromatin-modifying enzymes as modulators of reprogramming. Nature. 2012;483:598–602. - PMC - PubMed
    1. Marion RM, et al. A p53-mediated DNA damage response limits reprogramming to ensure iPS cell genomic integrity. Nature. 2009;460:1149–1153. - PMC - PubMed

Publication types

Substances