

Review
doi: 10.1016/j.conb.2015.01.007.
Epub 2015 Jan 28.
Large-scale imaging in small brains
Affiliations
- PMID: 25636154
- PMCID: PMC4955592
- DOI: 10.1016/j.conb.2015.01.007
Item in Clipboard
Review
Large-scale imaging in small brains
Curr Opin Neurobiol.
2015 Jun.
Abstract
The dense connectivity in the brain means that one neuron's activity can influence many others. To observe this interconnected system comprehensively, an aspiration within neuroscience is to record from as many neurons as possible at the same time. There are two useful routes toward this goal: one is to expand the spatial extent of functional imaging techniques, and the second is to use animals with small brains. Here we review recent progress toward imaging many neurons and complete populations of identified neurons in small vertebrates and invertebrates.
Copyright © 2015 Elsevier Ltd. All rights reserved.
Figures
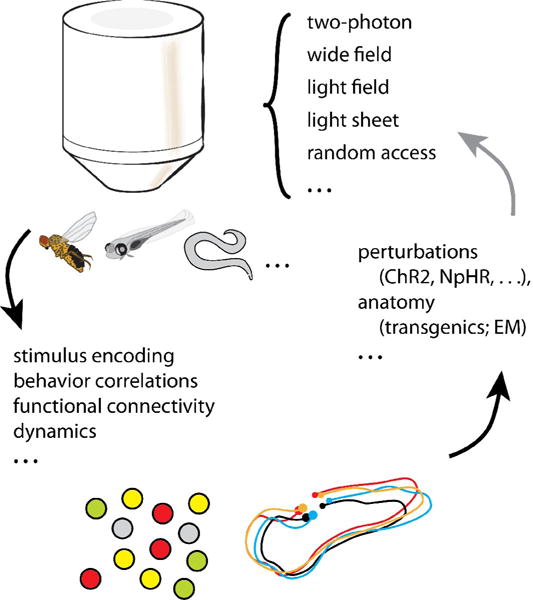
Many imaging techniques can be used for imaging neuronal activity at the population up to whole-brain level. Small brains have the advantage of fitting in the field of view of a microscope objective, and allowing orthogonal access for light-sheets. Analysis methods can be used for finding functional anatomical structure (left) and investigating neuronal dynamics (right). Optogenetic perturbations, genetic lesions and other manipulations, as well as anatomical characterization, may follow the insights gained from analysis of large-scale imaging data.
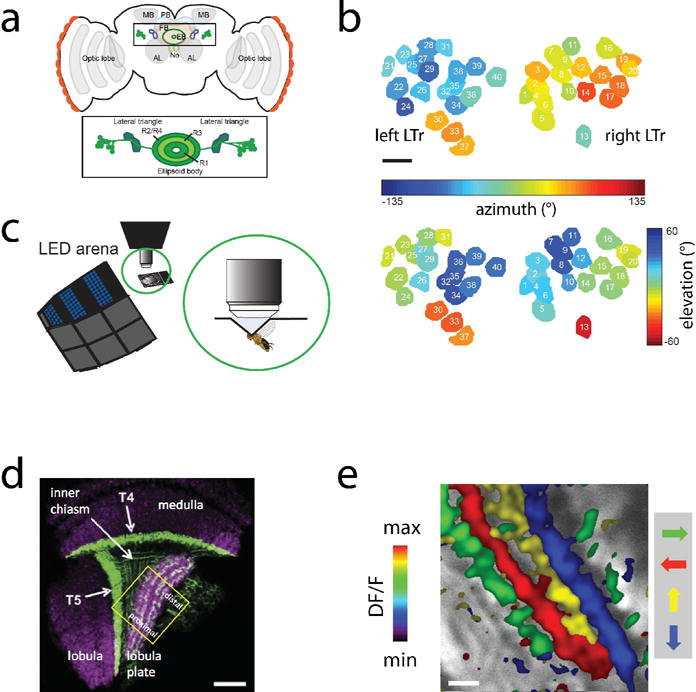
a. Anatomical structures in Drosophila central complex. LTR, lateral triangle neurons, whose glomeruli were recorded from in the ellipsoid body (EB). b. Spatial tuning of glomeruli responses. The responses were also tuned to orientation and sometimes direction (not shown). c. Virtual reality setup for flying Drosophila, which was used to study modulation of visual responses in the EB during flight. Scale bar: 5 micrometers. d. Anatomy of part of the visual system of Drosophila. Directional responses were studied in the lobula plate. Scale bar: 20 micrometers. e. Responses in lobula plate neurpil are directionally tuned. Scale bar: 5 micrometers. Panels a,b,c adapted with permission from Seelig and Jayaraman (2013) and c,d from Maisak et al. (2014).
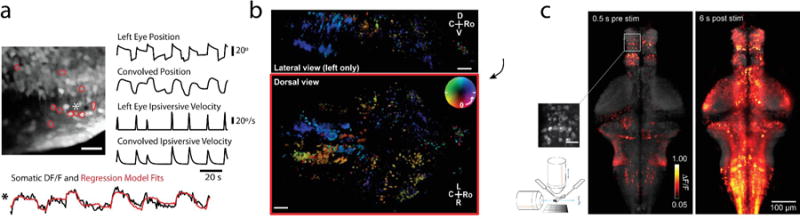
a. Imaging in the hindbrain during eye movements. Eye movements were monitored using a camera while dye-loaded cells in the hindbrain were imaged with a two-photon microscope. Regression analysis could be used to identify the combination of behavioral variables that best determined the neural activity. The example cell (1) is strongly tuned to left eye position. b. Whole-brain two-photon imaging in behaving zebrafish expressing GCaMP5G panneuronally. Individual planes are sequentially imaged with a two-photon microscope during rotational motion of a scene displayed underneath the fish, generating a phase response map across the brain representing the phase of the oscillating stimulus at which the neural response is strongest. At the same time, tail and eye position are monitored so that neural activity can be related to behavior. c. Whole-brain light-sheet imaging in fictively behaving larval zebrafish. The imaging rate is up to three brain volumes per second, so that relationships between neurons across the brain can be investigated, as well as their correlation to behavior and visual input. Depicted is a top-projection of whole-brain activity during the optomotor response, just before stimulus onset (left) and six seconds after stimulus onset (right). Electrical recordings from the motor neuron axons in the tail of the paralyzed animals record intended swimming behavior. Inset scale bar: 20 micrometers. Panel a adapted with permission from Miri et al. (2011), b from Portugues et al. (2014), c from Vladimirov et al. (2014).
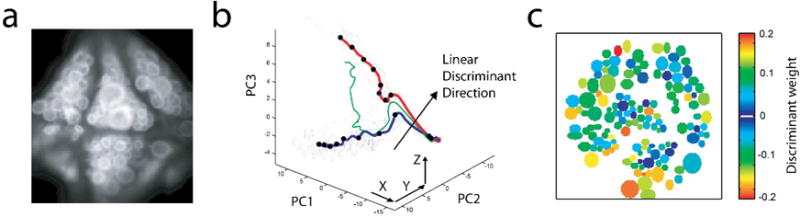
a. Micrograph of the ventral side of the ganglion, containing about 160 cells. b. The linear discriminant weights for all 143 recorded neurons that best separate trials on which neural stimulation led to fictive swimming versus fictive crawling. c. Representation of population activity in three dimensions, using projections onto the first three components arising from principal component analysis. Swimming trials are shown in blue, crawling trials in red. Using the linear discriminant weights, population activity can be decoded to predict swimming vs. crawling about a second before the behavior is evident at the nerves exiting the ganglion. Panels a,b,c adapted with permission from Briggman et al. 2005.
References
-
- Bargmann CI, Marder E. From the connectome to brain function. Nature Methods. 2013;10:483–490. - PubMed
-
- Denk W, Strickler JH, Webb WW. Two-photon laser scanning fluorescence microscopy. Science. 1990;248:73–76. - PubMed
-
- Schrödel T, Prevedel R, Aumayr K, Zimmer M, Vaziri A. Brain-wide 3D imaging of neuronal activity in Caenorhabditis elegans with sculpted light. Nature Methods. 2013;10:1013–1020. - PubMed
Publication types
MeSH terms
Grants and funding
LinkOut - more resources
Full Text Sources
Other Literature Sources
