Review
. 2015 Feb-Jun;109(1-3):104-17.
doi: 10.1016/j.jphysparis.2014.12.001. Epub 2015 Jan 28.

Mistakes were made: neural mechanisms for the adaptive control of action initiation by the medial prefrontal cortex

Affiliations
Review

Mistakes were made: neural mechanisms for the adaptive control of action initiation by the medial prefrontal cortex

Mark Laubach et al. J Physiol Paris. 2015 Feb-Jun.

Abstract

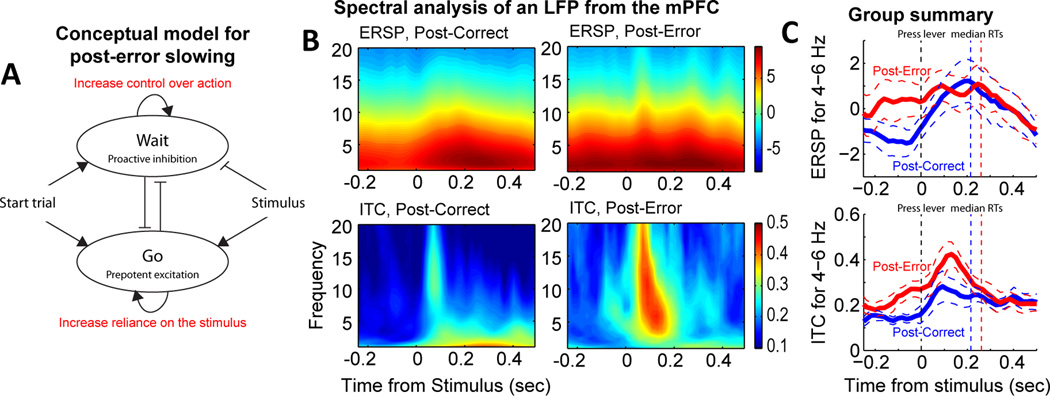
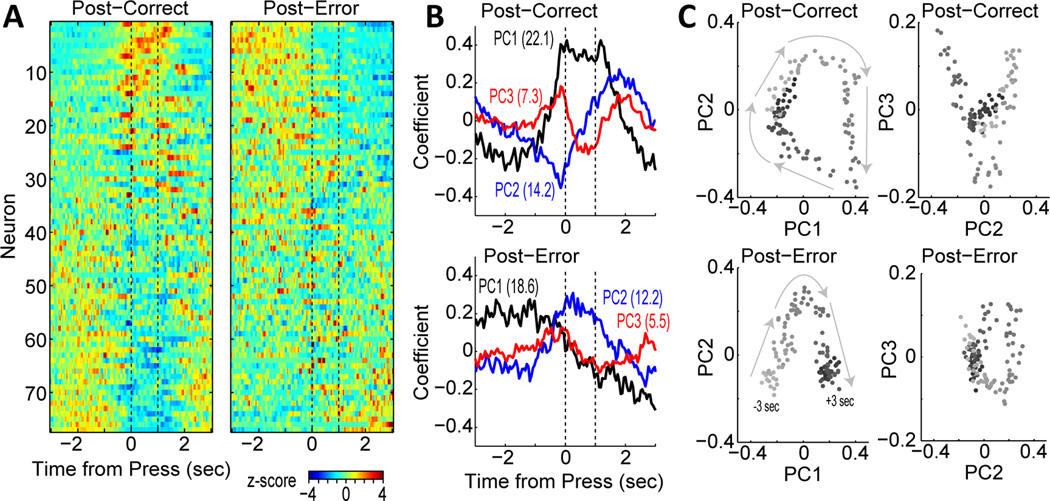
Studies in rats, monkeys and humans have established that the medial prefrontal cortex is crucial for the ability to exert adaptive control over behavior. Here, we review studies on the role of the rat medial prefrontal cortex in adaptive control, with a focus on simple reaction time tasks that can be easily used across species and have clinical relevance. The performance of these tasks is associated with neural activity in the medial prefrontal cortex that reflects stimulus detection, action timing, and outcome monitoring. We describe rhythmic neural activity that occurs when animals initiate a temporally extended action. Such rhythmic activity is coterminous with major changes in population spike activity. Testing animals over a series of sessions with varying pre-stimulus intervals showed that the signals adapt to the current temporal demands of the task. Disruptions of rhythmic neural activity occur on error trials (premature responding) and lead to a persistent encoding of the error and a subsequent change in behavioral performance (i.e. post-error slowing). Analysis of simultaneously recorded spike activity suggests that the presence of strong theta rhythms is coterminous with altered network dynamics, and might serve as a mechanism for adaptive control. Computational modeling suggests that these signals may enable learning from errors. Together, our findings contribute to an emerging literature and provide a new perspective on the neuronal mechanisms for the adaptive control of action.

Keywords: Anterior cingulate; Delta; Dynamics; Inhibition; Learning; Phase; Theta; Timing.


Figures

Figure 1
Figure 1
Rats, like humans, perform simple reaction time tasks as predicted by Kornblum's (1973) race model. (A) Behavioral procedure. Rats press on a lever to begin each trial and have to release the lever one sec later to earn a liquid reward (B) Kornblum's race model for explaining the contribution of time estimation and stimulus detection to response time variability.
Figure 2
Figure 2
Spectral analysis of field potentials from the medial prefrontal cortex of rats performing Kornblum's (1973) task. (A) Event-related potentials from trials with correct responses on tone and time trials (left and middle) and trials with premature responses (right). The color boxes denote the period of ERP analysis. There was a clear modulation of the ERP when the rat pressed on the lever to start the trials (0 sec, all trials) and again when the stimulus was presented (1 sec on tone trials). (B) Eventrelated spectral power for the three types of trials. There was persisting power in the theta range (4–8 Hz) throughout the trial and there was elevated power in the delta range (below 4Hz) when the rat pressed the lever before correct trials. Delta power also increased when the rat released the lever after the tone (blue asterisk). Delta power was notably reduced prior to premature errors (red asterisk). (C) Inter-trial coherence, or ITC, for the same types of trials. ITC measures the correlation in the phase angles over trials. High levels of ITC suggest that phase locking occurred around the task events. There was phase locking in the delta range when the rats pressed the lever before correct responses, but not before premature responses (red asterisk, right panel). There was also delta phase locking when the rats released the lever in response to the tone (blue asterisk, left panel) and theta phase locking after the stimulus.
Figure 3
Figure 3
Event-related potentials dissociate stimulus-triggered and timed actions. (A) Behavioral events are shown. The times of lever release are shown in the left pair of plots relative to the stimulus (tone trials) and deadline (time trials). The times of the tone and deadline in the right pairs of plots relative to the lever release on tone and time trials. (B) Field potentials from the mPFC are shown for the four events (tone, deadline, release after tone, and release after deadline). The tone, but not the deadline, was associated with an evoked potential. Release after the deadline, but not after the tone, was associated with an evoked potential. The evoked events could serve as time markers indicating transitions in the behavioral procedure from waiting to acting.
Figure 4
Figure 4
Delta rhythms in the medial prefrontal cortex are phase locked when the animals initiated timed actions. (A) Example of bandpass filtering and extraction of amplitude and phase using the Hilbert transform. (B) Single trial measurements of amplitude (top) and phase (bottom) from a typical field potential recording. (C) Raster plots for amplitude and phase on correct trials. Same recording as B. Trials are sorted by response latency. Boxplots (red) in B and C show the distribution of RTs.
Figure 5
Figure 5
Validation of low-frequency "delta" activity using a non-Fourier method. (A) Single-trial recording of a field potential from the prelimbic area during the simple RT task. (B) Standard FFT-based power spectrum for the signal in A, plotted on a log scale for power. Power was especially concentrated below 10 Hz and there was a peak in the gamma range. (C) Intrinsic Mode Functions (IMFs) found using a Empirical Mode Decomposition (Huang, 1989). This technique finds a set of harmonic functions ("waves") with the same number of extrema (max and min values) and zero crossings (sign reversals). The algorithm can be applied to a continuous recording (time series) of any type and will only return IMFs that satisfy the constraints defined above. This particular recording showed evidence for six wavelike components. The two lowest frequency components were similar to those found by using a traditional approach in LFP analysis of bandpass filtering and the Hilbert transform. (D) FFT-based power spectra for the six IMFs in C. The two lowest frequency components had peaks at 1.5 and 3 Hz, respectively, within the traditional “delta” range. The higher components were in the typical LFP ranges called theta, beta, low gamma, and high gamma. This analysis shows that the low-frequency rhythms described in Figures 2–4 and 6 are not simply the consequence of using the standard approach to LFP data analysis and the rhythmic components, especially in the delta range can be detected on single trials.
Figure 6
Figure 6
Delta phase locking in the medial prefrontal cortex tracks changes in the expected timing of action. (A) Behavioral testing used to evaluate temporal expectancy. Rats were trained to sustain lever presses for 1 sec to earn rewards. Then, they were tested in three sessions using Kornblum's (1973) procedure, with tones presented on half of the trials, in three sessions with a novel delay of 0.4 sec on half of trials, two sessions with tones at 0.4 sec on two-thirds of trials (short bias sessions), and finally two sessions with tones at 0.4 sec on one-third of trials (long bias sessions). (B) Response durations from a test session run after the final session with bias for the long foreperiod. This session was biased for short foreperiods and included no stimulus on 10% of the trials (catch trials). The rat responded at the time of the long foreperiod on the catch trials. This finding suggests that the rat learned to wait for 1 sec and then release the lever, and was not willing to wait longer for the stimulus. (C) Example of event-related potentials (ERPs) from one rat from the series of testing sessions. The large ERP associated with lever pressing diminished when the rat experienced the sessions with two potential stimulus times. An ERP was detected in those sessions when the stimulus occurred at 0.5 sec (green traces). The press-related ERP was enhanced when rats were tested in the long-bias sessions (bottom row). (D) The enhancement of delta range modulation developed within the first long-bias test session. The field potential shifted from showing limited modulation to showing strong modulation of amplitude and phase around trial 60.
Figure 7
Figure 7
Evidence for temporal integration of lever pressing by population activity in the medial prefrontal cortex. (A) Analysis of trial-averaged peri-event histograms using principal component analysis (PCA), as in Narayanan and Laubach (2009) and Bekolay et al. (2014). Activity from each neuron is shown in the matrix plot on the lower right. The PCA analysis finds the most common modes of firing (temporal patterns) from the ensemble of neurons. The temporal patterns were defined by the eigenvectors (PCs) from the analysis (upper matrix). The amount of variance accounted for by each PC was defined by the eigenvalues (noted in text next to the upper matrix). The extent to which each neuron expressed the firing patterns (i.e. were correlated with the PCs) were defined by the loadings (right matrix). (B) The neural firing patterns were sorted by the first and second leading PCs. This revealed sustained fluctuation of activity by many neurons during the delay period (PC1) and transient fluctuations around the press and release/reward events (PC2). (C) Plots of the two leading PCs showed the major firing patterns expressed by the medial prefrontal cortex neurons. PC1 is shown in solid blue and PC2 in shown in solid red. The cumulative sums of each function are plotted as dashed lines. PC1 was highly similar to the cumulative sum of PC2 and vice versa. Plots of PCs 2 and 3 did not reveal similar correspondences between the PCs and their cumulative sums.
Figure 8
Figure 8
Evidence for temporal integration of lever pressing by a single ensemble of mPFC neurons. (A) Raster plots for twelve simultaneously recorded neurons. Only trials with the tone stimulus and correct responding (sustained until tone and RT less than 0.6 sec) are shown. (B) Plots of the two leading PCs measured from the trial-averaged Spike Density Functions (SDFs) with a temporal resolution of 100 and 10 ms are shown in the upper plots. The same temporal patterns were identified by PCA at both time scales and these patterns were highly similar to the patterns found for the SDFs of the larger set of neurons from multiple rats (Narayanan and Laubach, 2009). Plots of the leading PC and the cumulative sum of the second PC are shown in the lower plots.. Integration occurred at both time scales. (C) Plots of the two leading PCs measured with an alternative approach using the full time series representing the neural spike train, analyzing a matrix comprised of neurons as the columns and samples (bins) as the rows (Chapin and Nicolelis, 1999; Laubach et al., 1999). The same patterns of firing rate modulation were found using this method (compare the upper plots in B and C) and the same evidence for temporal integration by the two leading PCs was also found using this analysis method.
Figure 9
Figure 9
Neural correlates of performance adjustments in the medial prefrontal cortex. (A) Conceptual model for adjustments in performance strategy. Errors could lead to rats increasing control over action (“inhibition”) and/or increasing stimulus processing (attention, integration). (B) Spectral analysis of field potentials showed evidence for both types of changes in processing. Comparisons of event-related spectral power on post-correct and post-error trials showed increased power at low frequencies just before the stimulus (−0.2 to 0 sec). Phase locking to the stimulus was enhanced on post-error trials, spanning the rages of theta and beta. (C) Group summary for spectral power and phase locking in the range of theta (4–8 Hz) for post-correct (blue) and post-error (red) trials. Dashed lines represent 95% confidence bands based on recordings of 28 field potentials recorded in 5 rats.
Figure 10
Figure 10
Altered integration of behavioral events after errors in the task. (A) neural firing patterns for post-correct and post-error trials, sorted by the first principal component (same data set as Figure 6). Notably lacking from the post-error trials was the sustained activity during the delay period (cells at top of left plot are not common on post-error trials). (B) Plots of the three leading PCs for the post-correct and post-error trials. PCs 1 and 2 from the post-correct trials was similar to PCs 2 and 3 from the posterror trials. PC1 from the post-error trials was not observed in the PCs defined by the post-correct trials. (C) Phase plots of the two leading PCs, with time encoded in gray scale. An attractor-like structure was found on post-correct trials (upper left plot), with activity looping through a common space in the period between the trials. A similar circular structure was found in the phase plots for PCs 2 and 3 on post-error trials (lower right plot). A very different structure was found in the phase space on post-error trials (lower left plot). There was a shift across the phase space over the period of the trial, and this was due to the transition in PC1 (high before trial, low after). A neural circuit model (Bekolay et a., 2014) of these functions showed that the shift in phase space led to neurons experiencing new synaptic weights during the inter-trial interval (post-error period), a finding that suggests that such transitions could enable learning from errors.

References

    1. Alexander WH, Brown JW. Medial prefrontal cortex as an action-outcome predictor. Nat Neurosci. 2011;14:1338–1344. - PMC - PubMed
    1. Allen GV, Saper CB, Hurley KM, Cechetto DF. Organization of visceral and limbic connections in the insular cortex of the rat. J Comp Neurol. 1991;311:1–16. - PubMed
    1. Allen TA, Narayanan NS, Kholodar-Smith DB, Zhao Y, Laubach M, Brown TH. Imaging the spread of reversible brain inactivations using fluorescent muscimol. J Neurosci Methods. 2008;171:30–38. - PMC - PubMed
    1. Amiez C, Joseph J-P, Procyk E. Anterior cingulate error-related activity is modulated by predicted reward. Eur J Neurosci. 2005;21:3447–3452. - PMC - PubMed
    1. Amiez C, Joseph JP, Procyk E. Reward encoding in the monkey anterior cingulate cortex. Cereb Cortex N Y N 1991. 2006;16:1040–1055. - PMC - PubMed

Publication types

LinkOut - more resources