. 2015 Oct;26(10):2521-33.
doi: 10.1681/ASN.2014090939. Epub 2015 Jan 30.

Interstitial Fibrosis Restricts Osmotic Water Transport in Encapsulating Peritoneal Sclerosis

Affiliations

Interstitial Fibrosis Restricts Osmotic Water Transport in Encapsulating Peritoneal Sclerosis

Johann Morelle et al. J Am Soc Nephrol. 2015 Oct.

Abstract

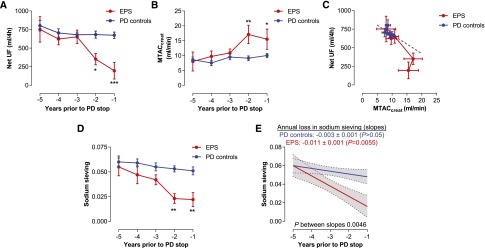
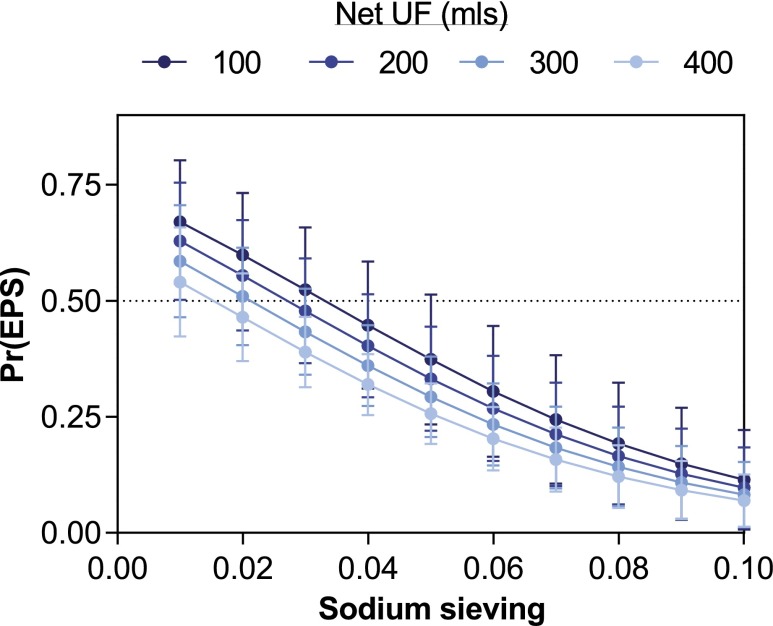
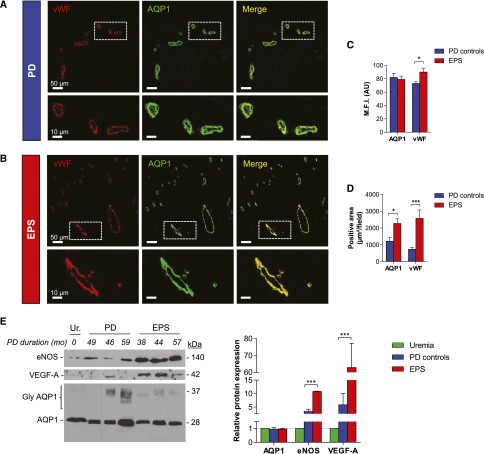
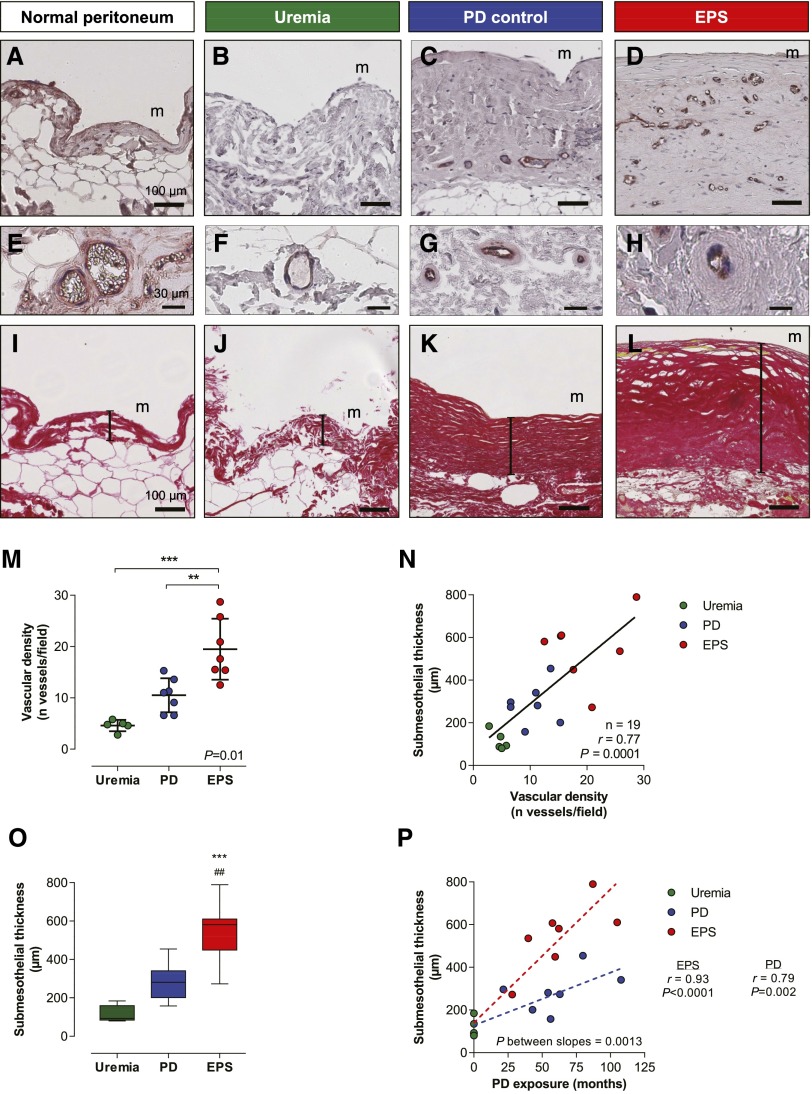
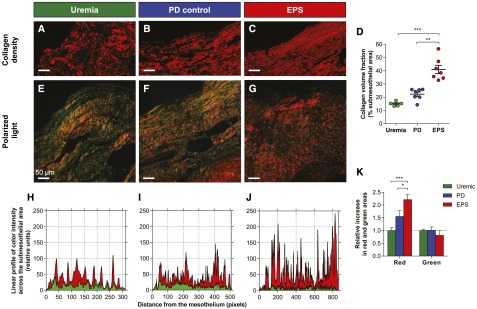
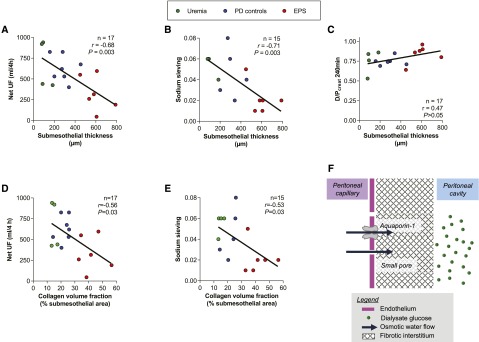
Encapsulating peritoneal sclerosis (EPS) is a rare but severe complication of peritoneal dialysis (PD) characterized by extensive fibrosis of the peritoneum. Changes in peritoneal water transport may precede EPS, but the mechanisms and potential predictive value of that transport defect are unknown. Among 234 patients with ESRD who initiated PD at our institution over a 20-year period, 7 subsequently developed EPS. We evaluated changes in peritoneal transport over time on PD in these 7 patients and in 28 matched controls using 3.86% glucose peritoneal equilibration tests. Compared with long-term PD controls, patients with EPS showed early loss of ultrafiltration capacity and sodium sieving before the onset of overt EPS. Multivariate analysis revealed that loss of sodium sieving was the most powerful predictor of EPS. Compared with long-term PD control and uremic peritoneum, EPS peritoneum showed thicker submesothelial fibrosis, with increased collagen density and a greater amount of thick collagen fibers. Reduced osmotic conductance strongly correlated with the degree of peritoneal fibrosis, but not with vasculopathy. Peritoneal fibrosis was paralleled by an excessive upregulation of vascular endothelial growth factor and endothelial nitric oxide synthase, but the expression of endothelial aquaporin-1 water channels was unaltered. Our findings suggest that an early and disproportionate reduction in osmotic conductance during the course of PD is an independent predictor of EPS. This functional change is linked to specific alterations of the collagen matrix in the peritoneal membrane of patients with EPS, thereby validating the serial three-pore membrane/fiber matrix and distributed models of peritoneal transport.

Keywords: peritoneal dialysis; ultrafiltration; vascular endothelial growth factor; water channels.


Figures

Figure 1.
Figure 1.
Early loss in UF capacity and sodium sieving in patients with EPS. (A) Patients who will develop EPS (red) have a premature loss in UF capacity, approximately 2 years before PD withdrawal, compared with PD controls (blue) matched in a 4:1 ratio for PD duration and sex. Control patients show a trend to lower UF with time on PD. (B) Small solute transport, evaluated by MTAC creatinine, tends to increase in PD controls but is significantly higher with time on PD in patients with EPS. (C) The loss of UF capacity is disproportionate to the increased MTAC creatinine in patients with EPS, suggestive of an uncoupling between peritoneal fluid and solute transport. The blue line corresponds to the projection of linear regression of net UF in control patients. (D) The sodium sieving significantly decreases with time on PD in patients with EPS, supporting the development of a low osmotic conductance to glucose. (E) The decline in sodium sieving over time on PD is more severe in patients with EPS compared with controls (slope −0.011±0.001 versus −0.003±0.001 in patients with EPS and controls, respectively; P=0.01). Longitudinal follow-up of membrane function was performed with annual modified 3.86% glucose-based dialysate. Data are presented as the mean±SEM (A–D) or mean±95% confidence interval (E). n=7 patients with EPS versus n=28 PD duration–matched and sex-matched controls. *P<0.05; **P<0.01; ***P<0.001. MTAC, mass transfer area coefficient.
Figure 2.
Figure 2.
Low sodium sieving and net ultrafiltration during PD are predictive of the risk of EPS. The risk of EPS, estimated by logistic regression analysis, progressively increases with lower values of sodium sieving and impaired UF capacity. In this cohort of long-term PD patients, the combination of UF failure (<400 ml during the 4-hour 3.86% modified PET) with a sodium sieving <0.03 is associated with a risk of EPS >50%. All values of sodium sieving and net UF obtained during the course of PD are included in the logistic regression analysis. n=7 patients with EPS versus n=28 long-term PD controls. Pr(EPS), probability of developing EPS.
Figure 3.
Figure 3.
Expression of AQP1 in the peritoneum of patients with EPS. (A and B) Representative pictures of double immunostaining with anti-AQP1 (green channel) and anti-vWf (red channel) antibodies viewed under confocal fluorescence microscopy in peritoneal sections from a patient with EPS (A) and a long-term PD control (B). AQP1 is expressed in endothelial cells lining the capillaries and small vessels in the peritoneal membrane, both in the patient with EPS with impaired water transport (net UF=190 ml, and sodium sieving=0.02, during a 4-hour modified 3.86% glucose base PET) and in the long-term PD control (net UF 675 ml and sodium sieving 0.04). (C) MFI in AQP1-positive and vWf-positive areas in peritoneal sections of PD controls (blue) and patients with EPS (red). In contrast with the stable fluorescent intensity of AQP1, the endothelial marker vWf is significantly upregulated in peritoneal vessels from patients with EPS compared with PD controls. (D) Increase in both AQP1-positive and vWf-positive areas in the peritoneal membrane of patients with EPS compared with controls, suggesting vascular proliferation. n=7 long-term PD controls, and n=7 patients with EPS. (E) Representative immunoblot images and quantitative data showing levels of eNOS, VEGF-A, and AQP1 in the peritoneum of three patients with EPS, three PD duration–matched patients, and one uremic patient. PD controls and patients with EPS show a significant upregulation of eNOS (3- and 11-fold, respectively) and VEGF-A (6- and 63-fold, respectively) in their peritoneal membrane, whereas the expression of AQP1 remains unchanged. Twenty micrograms of proteins are loaded in each lane. Molecular mass (in kilodaltons) is indicated on the right side of the blot. PD duration (months) is indicated in italics. MFI, mean fluorescence intensity; A.U., arbitrary units; gly AQP1 and AQP1, glycosylated and unglycosylated isoforms of AQP1. *P<0.05; ***P<0.001. Bar, 50 µm in A and B (low magnification); 10 µm in A and B (detail). Original magnification, ×20.
Figure 4.
Figure 4.
The EPS peritoneum is characterized by an excessive vascular and fibrotic response to PD. (A–D) Immunostaining for vWf in normal (A), uremic (B), control PD (C), and EPS (D) peritoneum shows a progressive vascular proliferation from A to D. (E–H) Representative sections of peritoneum with evaluation of the degree of vasculopathy in the postcapillary venules stained for vWf in normal (E), uremic (F), control PD (G), and EPS (H) peritoneum. Long-term exposure to PD and EPS both associate with a thickening of the capillary wall in venules with a 25- to 50-µm diameter. (I–L) Representative sections of parietal peritoneum from normal (I), uremic (J), control PD (K), and EPS (L) peritoneum stained with picrosirius red. Submesothelial thickness, represented by the vertical bar drawn between the mesothelial surface and the upper limit of the adipose tissue, significantly increases from I to L. (M–O) Peritoneal vascular proliferation and fibrosis are more severe in patients with EPS compared with PD controls matched for the same PD duration. (P) Submesothelial fibrosis correlates with time on PD in both groups, but correlation is clearly steeper in patients with EPS compared with PD patients with no EPS. Peritoneal samples are from five uremic patients, seven long-term PD patients without EPS, and seven patients with EPS. Circles represent individuals (M, N, and P; green circles for uremic, blue for PD controls, and red for patients with EPS). Box and whiskers (minimum to maximum) are represented in C. ##P<0.01 versus PD; **P<0.01; ***P<0.001 versus uremia. m, mesothelium. Bar, 100 µm in A–D and I–L. Original magnification, ×20 in A–D and I–L (top); ×40 in A–D and I–L (bottom).
Figure 5.
Figure 5.
Changes in collagen density and quality in the peritoneal interstitium of patients with EPS. (A–C) Representative sections of the parietal peritoneum from uremic (A), PD (B), and EPS (C) patients stained with picrosirius red and visualized under circularly polarized light. Stained tissue (red mask) indicates collagen fibers in the submesothelial area. (D) Collagen volume fraction from picrosirius red–stained peritoneum as percentage of submesothelial area from uremic (green circles), PD (blue), and EPS (red) patients. (E–G) Representative sections of the peritoneum from uremic (E), PD (F), and EPS (G) patients stained with picrosirius red, visualized under circularly polarized light. Thick collagen fibers appear red-orange and thinner ones are green-yellow. (H–J) Profile of red and green intensities along a line perpendicular to the mesothelial surface, from the mesothelium to the adipose tissue in peritoneal biopsies from uremic (H), PD (I), and EPS (J) patients. The x axis represents the distance from the mesothelial surface, in pixels. (K) Relative increase in the red- and green-positive areas in the submesothelium of uremic (reference), PD, and EPS patients. The relative proportion of red, thicker, collagen fibers increases in the EPS submesothelial area compared with uremic and PD controls. Data are the mean±SEM. n=5, n=7, and n=7 in uremic, long-term PD, and EPS peritoneum, respectively. *P<0.05; **P<0.01; ***P<0.001. Bar, 50 µm. Original magnification, ×20.
Figure 6.
Figure 6.
Fibrotic changes in the EPS peritoneum associate with impaired water but not solute transport. (A–C) Correlation between net UF (A), sodium sieving (B), and dialysate-over-plasma creatinine (D/P) ratio at 4 hours (C), and submesothelial thickness in PD patients. (D and E) Correlation between net UF (D) and sodium sieving (E), and collagen volume fraction in the submesothelial area. (A–E) Circles represent individuals; green circles for uremic patients, blue for PD patients, and red for EPS patients. The number of observations, r Pearson coefficients, and P values are shown in each panel. Peritoneal transport parameters are obtained using a modified 4-hour 3.86% glucose-based dialysate PET. (F) The serial three-pore membrane/fiber matrix model (adapted from 20). Interstitial fibrosis acts as a second resistance, in series with the capillary wall, and markedly reduces the UF coefficient of the membrane, contributing to the loss of sodium sieving and free-water transport, despite the fact that the capillary αc (i.e., AQP1 density) remains unchanged.

References

    1. Jain AK, Blake P, Cordy P, Garg AX: Global trends in rates of peritoneal dialysis. J Am Soc Nephrol 23: 533–544, 2012 - PMC - PubMed
    1. Mehrotra R, Chiu YW, Kalantar-Zadeh K, Bargman J, Vonesh E: Similar outcomes with hemodialysis and peritoneal dialysis in patients with end-stage renal disease. Arch Intern Med 171: 110–118, 2011 - PubMed
    1. Davies SJ, Phillips L, Naish PF, Russell GI: Peritoneal glucose exposure and changes in membrane solute transport with time on peritoneal dialysis. J Am Soc Nephrol 12: 1046–1051, 2001 - PubMed
    1. Devuyst O, Margetts PJ, Topley N: The pathophysiology of the peritoneal membrane. J Am Soc Nephrol 21: 1077–1085, 2010 - PubMed
    1. Devuyst O, van Westrhenen R, Topley N: Longterm peritoneal dialysis patients. In: Nolph and Gokal’s Textbook of Peritoneal Dialysis, edited by Khanna R, Krediet RT, 3rd Ed., New York, Springer, 2009, pp 757–780

Publication types

LinkOut - more resources