. 2015 Apr;5(4):380-95.
doi: 10.1158/2159-8290.CD-14-0892. Epub 2015 Jan 30.

The genetics of splicing in neuroblastoma

Affiliations

The genetics of splicing in neuroblastoma

Justin Chen et al. Cancer Discov. 2015 Apr.

Abstract

Regulation of mRNA splicing, a critical and tightly regulated cellular function, underlies the majority of proteomic diversity and is frequently disrupted in disease. Using an integrative genomics approach, we combined both genomic data and exon-level transcriptome data in two somatic tissues (cerebella and peripheral ganglia) from a transgenic mouse model of neuroblastoma, a tumor that arises from the peripheral neural crest. Here, we describe splicing quantitative trait loci associated with differential splicing across the genome that we use to identify genes with previously unknown functions within the splicing pathway and to define de novo intronic splicing motifs that influence splicing from hundreds of bases away. Our results show that these splicing motifs represent sites for functional recurrent mutations and highlight novel candidate genes in human cancers, including childhood neuroblastoma.

Significance: Somatic mutations with predictable downstream effects are largely relegated to coding regions, which comprise less than 2% of the human genome. Using an unbiased in vivo analysis of a mouse model of neuroblastoma, we have identified intronic splicing motifs that translate into sites for recurrent somatic mutations in human cancers.


Conflict of interest statement

Disclosure Declaration

The authors do not have any conflicts of interest.

Figures
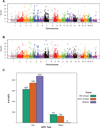
Figure 1
Figure 1. Genomic distribution of sQTL
sQTL are distributed throughout the genome similarly in CB (A) and SCG (B). The x-axis indicates the location of each SNP, and the y-axis indicates the level of significance of an associated sQTL. The horizontal red line is drawn to mark an estimation of genome-wide significance at an FDR < 0.05. C) Cis-sQTL were more abundant than trans-sQTL, and a majority were shared between both tissues. In contrast, trans-sQTL were largely tissue specific.
FIgure 2
FIgure 2. Trans-sQTL in the cerebellum and SCG
A. Circos plot of 162 cerebella and 131 SCG trans-sQTL identified at an FDR < 0.05. Mouse chromosomes are plotted on the outer ring, with locations of SNPs with sQTL indicated in black on the first inner ring. Locations of spliced exons are identified in blue on the second inner ring. Each trans-sQTL (paired association between SNP and alternatively spliced exon) is depicted by a line that links the exon and the SNP in SCG (purple), and cerebellum (green), with sQTL shared between both tissues drawn in black. The histogram outside of the chromosomes indicates the number of sQTL (on a scale of 1–8) that co-localize at any given genomic locus. B. Circos plot of sQTL hotspots, where 4 or more co-localized. An additional data track between the chromosome ideograms and SNP loci indicates differentially expressed genes at the transcript level (purple = higher expression in SCG, green = higher expression in CB). Five SCG-specific trans-sQTL mapped to rs29347557 on chromosome 10. This region included differential expression of SF3B5, encoding a splicing factor subunit. Eight CB-specific trans-sQTL mapped to rs33477935 on the X chromosome. Shown are the locations of the candidate genes that are differentially expressed at this locus.
Figure 3
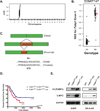
Figure 3. Fubp1 possesses a cis-sQTL
A. The sQTL for Fubp1 has a LOD score of 73.9 on chromosome 3 where the gene is located, indicating a cis effect. B. Normalized Exon Expression (NEE) levels for Fubp1 Exon 5 show loss of expression associated with the homozygous 129/SvJ allele. C. Exon 5 of FUBP1 is a site of triplet splicing. The distal isoform leads to incorporation of a serine at position 97 (FUBP197S) whereas the proximal isoform lacks the serine (FUBP197-). D. MYCN non-amplified neuroblastoma patients with high FUBP197-:FUBP197S ratios (red, n=52) had a reduced event free survival when compared to those with low FUBP197-:FUBP197S ratios (blue, n=52, log-rank p = 0.0486). There was not a significant difference in survival across all neuroblastoma patients (data not shown, n =134). E. Western Blot of human neuroblastoma cell lines transduced with GFP control, FUBP197S, or FUBP197- lentivirus tagged with V5. MYC is upregulated in both SHEP and SK-N-AS lines in the presence of high FUBP197- levels.
Figure 4
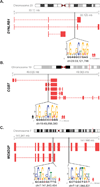
Figure 4. Recurrent somatic mutations occur in intronic splicing motifs in neuroblastoma
Analysis of 40 neuroblastoma samples reveals enrichment of somatic mutations in splicing motifs in DYNLRB1 (A), CGB7 (B), and MOXD2P (C). Germline variants (GVs) and somatic mutations (SMs) were identified by MuTect. MAST was used to examine the sequence immediately surrounding both intronic GVs and intronic SMs for a match to any of the 22 splicing motifs (sequence-level match p < 0.0001). The sequence logo of the splicing motif is drawn linked to the physical genomic location of the somatic mutation (black line). The total height of each nucleotide position is the information content in bits and represents the level of conservation for that position. The height of each nucleotide letter represents the ratio that they are found to occupy that position. The gene structures of known isoforms are depicted in red with arrows indicating the direction of transcription. The reference sequence (black) is given directly beneath the sequence logo with the position and nucleotide of the mutant allele shown in red. Red silhouettes indicate the number of tumor samples with that particular mutation. A black silhouette indicates the allele was found in a normal sample. A. Two neuroblastoma samples (5%) had a recurrent C>T mutation within DYNLRB1 at chr20:33,121,706. This mutation created a stronger match to a splicing motif by substituting a base found infrequently to a base more commonly associated with the motif. B. Two tumor samples had a recurrent G>C mutation at chr19:49,558,080 within CGB7; another neuroblastoma germline sample was also found to be G/C heterozygous at the same position. The splicing motif matched here was the same as observed in the DYNLRB1 mutation, and when analyzed in the orientation of the corresponding transcript, this mutation effectively destroyed the match to the motif. C. Two neuroblastoma samples were identified with distinct splicing motif mutations at chr7:141,944,631 (C>T) and chr7:141,943,454 (A>C) in MOXD2P. When analyzed in the orientation of the corresponding transcript, the mutation at chr7:141,944,631 destroyed a splicing motif match whereas the chr7:141,943,454 mutation resulted in creating a match to the splicing motif.
Figure 5
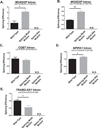
Figure 5. Recurrent somatic mutations in intronic splicing motifs affect splicing efficiency
A. The mutant splicing motif allele within MOXD2P at chr7:141943454 led to >3-fold increase in splicing efficiency (213.8%) compared to the wild-type allele (p = 0.0317). B. The mutant splicing motif allele within MOXD2P at chr7:141944631 led to an increase in splicing efficiency (93.9%) compared to the wild-type allele (p = 0.0015). C. No changes were detected between the mutant and wild-type splicing motif allele in the CGB7 intron. D. The mutant splicing motif allele within NPIPA1 at chr16:15040359 led to a 14% increase in splicing efficiency compared to the wild-type allele (p=0.0478). E. The mutant splicing motif allele at chr6:52445058 within TRAM2-AS1 resulted in a decrease to 56% splicing efficiency compared to the wild-type allele (p=0.0375). Splicing efficiency was measured as the relative expression of the canonical eGFP transcript compared to the expression of plasmid Neomycin resistance marker. Shown are representative means from at least 3 independent experiments. Error bars represent S.E.M. N.D. = Not Detected. Significance was assessed by Student’s t test.
Figure 6
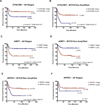
Figure 6. DYNLRB1, AIMP1, and NPIPA1 expression correlate with survival in neuroblastoma
Kaplan-Meier analysis of genes containing recurrent splicing motif mutations in two datasets, one containing all stages of neuroblastoma and the other containing only MYCN non-amplified neuroblastoma, reveals low expression of DYNLRB1 correlates with poor overall and event-free survival compared to high expression (A and B, p=8.40×10⁻³ and p=4.49×10⁻³). High AIMP1 expression correlates with poor overall and event-free survival compared to low expression in both datasets (C and D, p=5.62×10⁻⁴ and p=3.16×10⁻⁴). Low expression of NPIPA1 correlates with poor event-free survival compared to high expression, but is only significant in the MYCN non-amplified cohort (E and F, p=2.10×10⁻³ and p=N.S.) False detection rates (FDR) are given for the identification of the high and low expression groups. Significance was assessed by the log-rank test.

Similar articles

Cited by

References

    1. Kwan T, Benovoy D, Dias C, Gurd S, Serre D, Zuzan H, et al. Heritability of alternative splicing in the human genome. Genome Res. 2007;17:1210–1218. - PMC - PubMed
    1. Garcia-Blanco M, Baraniak A, Lasda E, Baraniak E. Nat Biotechnol. Vol. 22. Nature Publishing Group; 2004. Alternative splicing in disease and therapy; pp. 535–546. - PubMed
    1. Chen J, Weiss WA. Oncogene. Macmillan Publishers Limited; 2014. Alternative splicing in cancer: implications for biology and therapy. - PubMed
    1. Brooks AN, Choi PS, de Waal L, Sharifnia T, Imielinski M, Saksena G, et al. A Pan-Cancer Analysis of Transcriptome Changes Associated with Somatic Mutations in U2AF1 Reveals Commonly Altered Splicing Events. In: Ast G, editor. PLoS One. Vol. 9. Public Library of Science; 2014. p. e87361. - PMC - PubMed
    1. Yoshida K, Sanada M, Shiraishi Y, Nowak D, Nagata Y, Yamamoto R, et al. Frequent pathway mutations of splicing machinery in myelodysplasia. Nature. 2011;478:64–69. - PubMed

Publication types

MeSH terms