MiR-130b plays an oncogenic role by repressing PTEN expression in esophageal squamous cell carcinoma cells
- PMID: 25637514
- PMCID: PMC4318221
- DOI: 10.1186/s12885-015-1031-5
MiR-130b plays an oncogenic role by repressing PTEN expression in esophageal squamous cell carcinoma cells
Abstract
Background: Esophageal carcinoma is one of the most common malignancies with high cancer-related morbidity and mortality worldwide. MicroRNAs (miRNAs) are a class of small non-coding RNAs that regulate a wide variety of cellular processes, and also play an important role in the development and progression of cancers. In a previous microarray study, we demonstrated that miR-130b was upregulated in esophageal squamous cell carcinoma (ESCC) tissues. However, the biologic functions and the molecular mechanism of miR-130b in ESCC remain to be elucidated.
Methods: qRT-PCR assays were used to quantify miR-130b expression levels in ESCC samples. Novel targets of miR-130b were identified via a bioinformatics search and confirmed using a dual-luciferase reporter system. Western blotting and qRT-PCR assays were used to quantify the expression of the target gene PTEN (phosphatase and tensin homolog) and the downstream effector, Akt. ESCC cells over- or underexpressing miR-130b were analyzed for in vitro biologic functions.
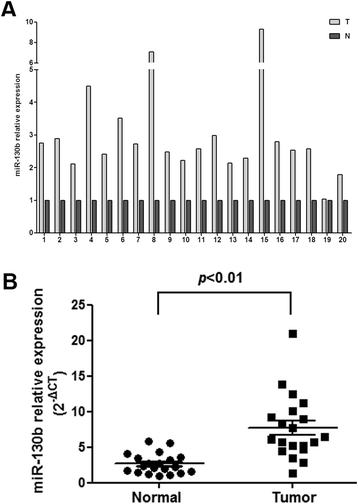
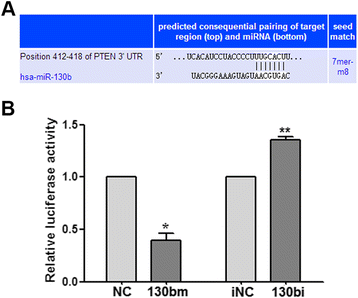
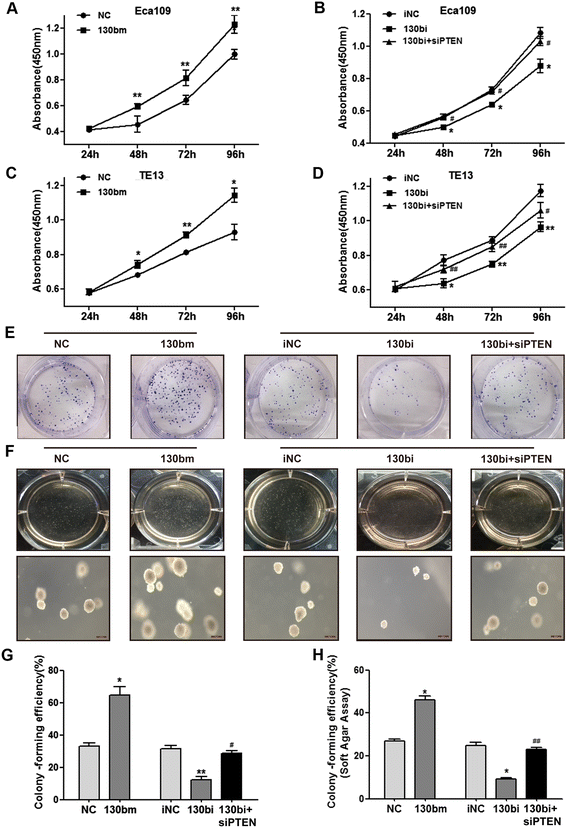
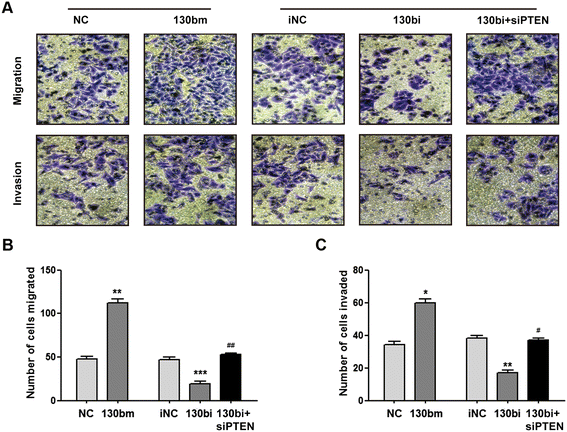
Results: High levels of miR-130b were identified in 20 ESCC samples following comparison with adjacent non-neoplastic tissues. We confirmed that miR-130b interacted with the 3'-untranslated region of PTEN, and that an increase in the expression level of miR-130b negatively affected the protein level of PTEN. However, the dysregulation of miR-130b had no obvious impact on PTEN mRNA. As Akt is a downstream effector of PTEN, we explored if miR-130b affected Akt expression, and found that miR-130b indirectly regulated the level of phosphorylated Akt, while total Akt protein remained unchanged. Overexpression of miR-130b increased the proliferation of ESCC cells and enhanced their ability to migrate and invade. In contrast, the proliferation, migration, and invasion of ESCC cells were weakened when miR-130b expression was suppressed, which was reversed by PTEN-targeted siRNA.
Conclusion: The results indicate that miR-130b plays an oncogenic role in ESCC cells by repressing PTEN expression and Akt phosphorylation, which would be helpful in developing miRNA-based treatments for ESCC.
Figures


Similar articles
-
Downregulation of MiR-31 stimulates expression of LATS2 via the hippo pathway and promotes epithelial-mesenchymal transition in esophageal squamous cell carcinoma.J Exp Clin Cancer Res. 2017 Nov 16;36(1):161. doi: 10.1186/s13046-017-0622-1. J Exp Clin Cancer Res. 2017. PMID: 29145896 Free PMC article.
-
MiR-130b promotes the progression of oesophageal squamous cell carcinoma by targeting SASH1.J Cell Mol Med. 2019 Jan;23(1):93-103. doi: 10.1111/jcmm.13887. Epub 2018 Nov 15. J Cell Mol Med. 2019. PMID: 30443973 Free PMC article.
-
LncRNA-TUSC7/miR-224 affected chemotherapy resistance of esophageal squamous cell carcinoma by competitively regulating DESC1.J Exp Clin Cancer Res. 2018 Mar 12;37(1):56. doi: 10.1186/s13046-018-0724-4. J Exp Clin Cancer Res. 2018. PMID: 29530057 Free PMC article.
-
MiR-132 promotes the proliferation, invasion and migration of human pancreatic carcinoma by inhibition of the tumor suppressor gene PTEN.Prog Biophys Mol Biol. 2019 Nov;148:65-72. doi: 10.1016/j.pbiomolbio.2017.09.019. Epub 2017 Sep 20. Prog Biophys Mol Biol. 2019. PMID: 28941804 Review.
-
Roles of PTEN inactivation and PD-1/PD-L1 activation in esophageal squamous cell carcinoma.Mol Biol Rep. 2022 Jul;49(7):6633-6645. doi: 10.1007/s11033-022-07246-y. Epub 2022 Mar 17. Mol Biol Rep. 2022. PMID: 35301651 Review.
Cited by
-
The PTEN tumor suppressor gene and its role in lymphoma pathogenesis.Aging (Albany NY). 2015 Dec;7(12):1032-49. doi: 10.18632/aging.100855. Aging (Albany NY). 2015. PMID: 26655726 Free PMC article. Review.
-
The Emerging Role of miRNAs in HTLV-1 Infection and ATLL Pathogenesis.Viruses. 2015 Jul 20;7(7):4047-74. doi: 10.3390/v7072805. Viruses. 2015. PMID: 26205403 Free PMC article. Review.
-
Chronic nicotine exposure alters sperm small RNA content in C57BL/6J mouse model.Dev Psychobiol. 2023 Mar;65(2):e22367. doi: 10.1002/dev.22367. Dev Psychobiol. 2023. PMID: 36811365 Free PMC article. Review.
-
The CTIP-mediated repair of TNF-α-induced DNA double-strand break was impaired by miR-130b in cervical cancer cell.Cell Biochem Funct. 2019 Oct;37(7):534-544. doi: 10.1002/cbf.3430. Epub 2019 Aug 16. Cell Biochem Funct. 2019. PMID: 31418900 Free PMC article.
-
Surveilling the Potential for Precision Medicine-driven PD-1/PD-L1-targeted Therapy in HNSCC.J Cancer. 2017 Feb 9;8(3):332-344. doi: 10.7150/jca.17547. eCollection 2017. J Cancer. 2017. PMID: 28261333 Free PMC article. Review.
References
-
- Kamangar F, Dores GM, Anderson WF. Patterns of cancer incidence, mortality, and prevalence across five continents: defining priorities to reduce cancer disparities in different geographic regions of the world. J Clin Oncol Off J Am Soc Clin Oncol. 2006;24(14):2137–50. doi: 10.1200/JCO.2005.05.2308. - DOI - PubMed
Publication types
MeSH terms
Substances
LinkOut - more resources
Full Text Sources
Other Literature Sources
Medical
Research Materials

