

Omics Pipe: a community-based framework for reproducible multi-omics data analysis
- PMID: 25637560
- PMCID: PMC4443682
- DOI: 10.1093/bioinformatics/btv061
Omics Pipe: a community-based framework for reproducible multi-omics data analysis
Abstract
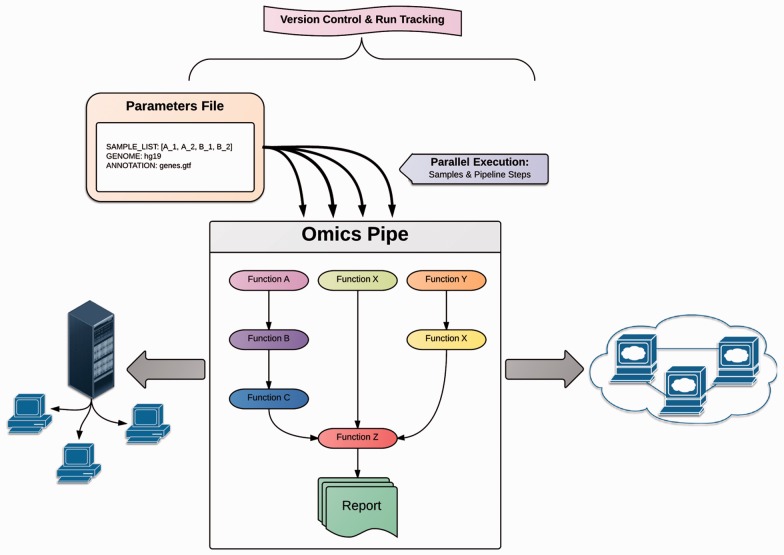
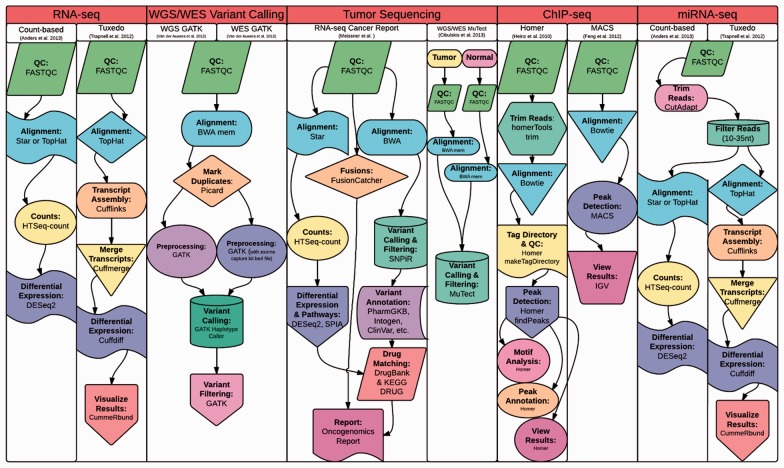
Motivation: Omics Pipe (http://sulab.scripps.edu/omicspipe) is a computational framework that automates multi-omics data analysis pipelines on high performance compute clusters and in the cloud. It supports best practice published pipelines for RNA-seq, miRNA-seq, Exome-seq, Whole-Genome sequencing, ChIP-seq analyses and automatic processing of data from The Cancer Genome Atlas (TCGA). Omics Pipe provides researchers with a tool for reproducible, open source and extensible next generation sequencing analysis. The goal of Omics Pipe is to democratize next-generation sequencing analysis by dramatically increasing the accessibility and reproducibility of best practice computational pipelines, which will enable researchers to generate biologically meaningful and interpretable results.
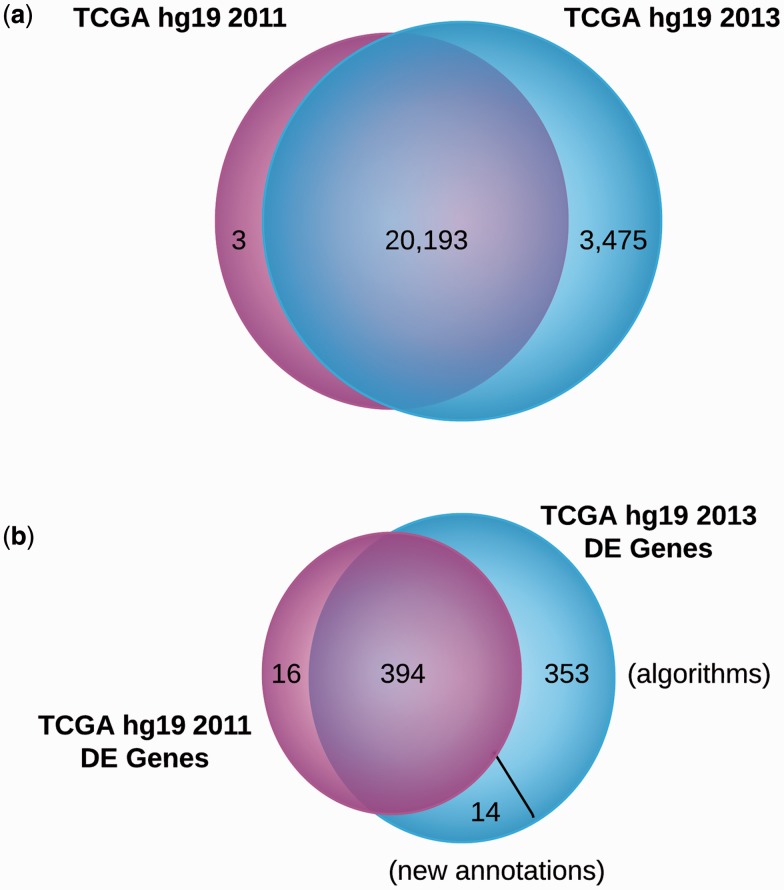
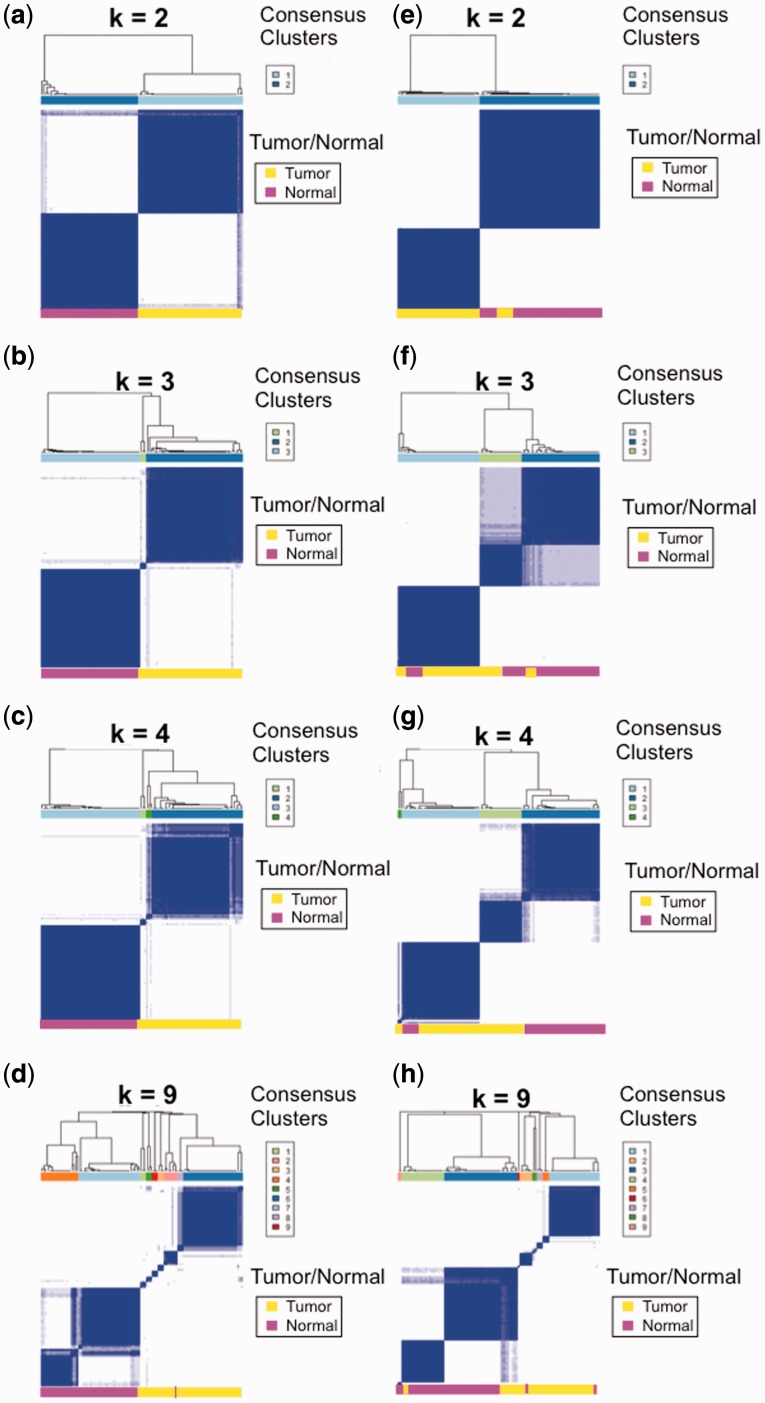
Results: Using Omics Pipe, we analyzed 100 TCGA breast invasive carcinoma paired tumor-normal datasets based on the latest UCSC hg19 RefSeq annotation. Omics Pipe automatically downloaded and processed the desired TCGA samples on a high throughput compute cluster to produce a results report for each sample. We aggregated the individual sample results and compared them to the analysis in the original publications. This comparison revealed high overlap between the analyses, as well as novel findings due to the use of updated annotations and methods.
Availability and implementation: Source code for Omics Pipe is freely available on the web (https://bitbucket.org/sulab/omics_pipe). Omics Pipe is distributed as a standalone Python package for installation (https://pypi.python.org/pypi/omics_pipe) and as an Amazon Machine Image in Amazon Web Services Elastic Compute Cloud that contains all necessary third-party software dependencies and databases (https://pythonhosted.org/omics_pipe/AWS_installation.html).
© The Author 2015. Published by Oxford University Press. All rights reserved. For Permissions, please email: journals.permissions@oup.com.
Figures
Similar articles
-
svist4get: a simple visualization tool for genomic tracks from sequencing experiments.BMC Bioinformatics. 2019 Mar 6;20(1):113. doi: 10.1186/s12859-019-2706-8. BMC Bioinformatics. 2019. PMID: 30841857 Free PMC article.
-
NGS-pipe: a flexible, easily extendable and highly configurable framework for NGS analysis.Bioinformatics. 2018 Jan 1;34(1):107-108. doi: 10.1093/bioinformatics/btx540. Bioinformatics. 2018. PMID: 28968639 Free PMC article.
-
HTSeq--a Python framework to work with high-throughput sequencing data.Bioinformatics. 2015 Jan 15;31(2):166-9. doi: 10.1093/bioinformatics/btu638. Epub 2014 Sep 25. Bioinformatics. 2015. PMID: 25260700 Free PMC article.
-
IOAT: an interactive tool for statistical analysis of omics data and clinical data.BMC Bioinformatics. 2021 Jun 15;22(1):326. doi: 10.1186/s12859-021-04253-x. BMC Bioinformatics. 2021. PMID: 34130622 Free PMC article. Review.
-
MOBCdb: a comprehensive database integrating multi-omics data on breast cancer for precision medicine.Breast Cancer Res Treat. 2018 Jun;169(3):625-632. doi: 10.1007/s10549-018-4708-z. Epub 2018 Feb 10. Breast Cancer Res Treat. 2018. PMID: 29429018 Review.
Cited by
-
GenPipes: an open-source framework for distributed and scalable genomic analyses.Gigascience. 2019 Jun 1;8(6):giz037. doi: 10.1093/gigascience/giz037. Gigascience. 2019. PMID: 31185495 Free PMC article.
-
The Metagenomics and Metadesign of the Subways and Urban Biomes (MetaSUB) International Consortium inaugural meeting report.Microbiome. 2016 Jun 3;4(1):24. doi: 10.1186/s40168-016-0168-z. Microbiome. 2016. PMID: 27255532 Free PMC article.
-
miARma-Seq: a comprehensive tool for miRNA, mRNA and circRNA analysis.Sci Rep. 2016 May 11;6:25749. doi: 10.1038/srep25749. Sci Rep. 2016. PMID: 27167008 Free PMC article.
-
Machine Learning and Integrative Analysis of Biomedical Big Data.Genes (Basel). 2019 Jan 28;10(2):87. doi: 10.3390/genes10020087. Genes (Basel). 2019. PMID: 30696086 Free PMC article. Review.
-
OncoRep: an n-of-1 reporting tool to support genome-guided treatment for breast cancer patients using RNA-sequencing.BMC Med Genomics. 2015 May 21;8:24. doi: 10.1186/s12920-015-0095-z. BMC Med Genomics. 2015. PMID: 25989980 Free PMC article.
References
-
- Anders S., et al. (2013). Count-based differential expression analysis of RNA sequencing data using R and Bioconductor. Nat. Protoc. , 8, 1765–1786. - PubMed
-
- Bywater M.J., et al. (2013). Dysregulation of the basal RNA polymerase transcription apparatus in cancer. Nat. Rev. Cancer , 13, 299–314. - PubMed
-
- Davison A. (2012). Automated capture of experiment context for easier reproducibility in computational research. Comput. Sci. Eng. , 14, 48–56.
Publication types
MeSH terms
Grants and funding
LinkOut - more resources
Full Text Sources
Other Literature Sources
Molecular Biology Databases
