. 2015 Apr 10;359(2):314-24.
doi: 10.1016/j.canlet.2015.01.035. Epub 2015 Jan 28.

Discriminating patients with early-stage pancreatic cancer or chronic pancreatitis using serum electrospray mass profiling

Affiliations

Discriminating patients with early-stage pancreatic cancer or chronic pancreatitis using serum electrospray mass profiling

James R Hocker et al. Cancer Lett. .

Abstract

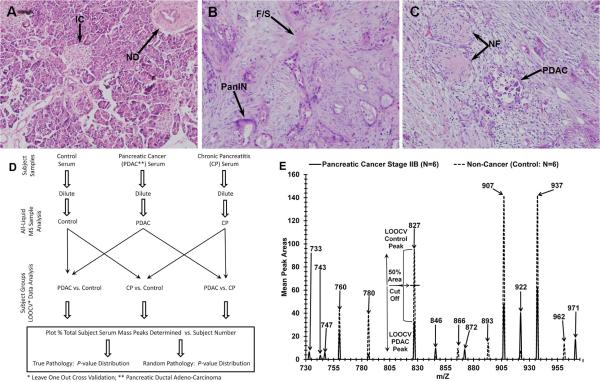
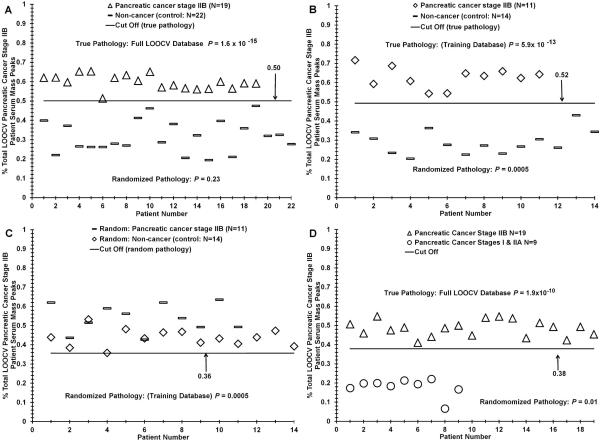
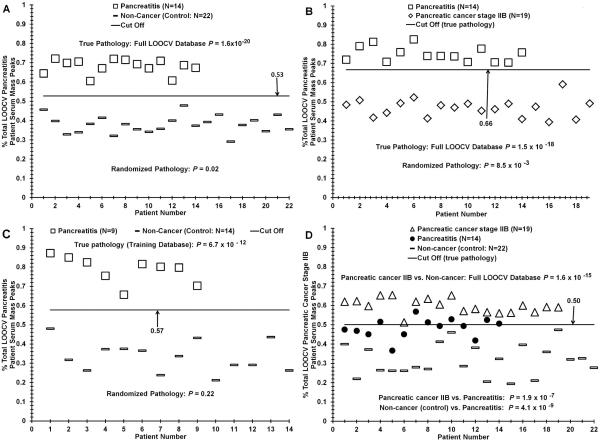
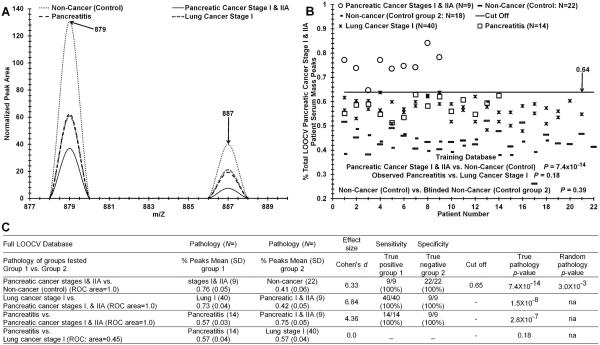
Blood tests are needed to aid in the early detection of pancreatic ductal adenocarcinoma (PDAC), and monitoring pancreatitis development into malignancy especially in high risk patients. This study exhibits efforts and progress toward developing such blood tests, using electrospray-mass spectrometry (MS) serum profiling to distinguish patients with early-stage PDAC or pancreatitis from each other and from controls. Identification of significant serum mass peak differences between these individuals was performed using t tests and "leave one out" cross validation. Serum mass peak distributions of control individuals were distinguished from those of patients with chronic pancreatitis or early-stage PDAC with P values <10(-15), and patients with chronic pancreatitis were distinguished from those of patients with early-stage PDAC with a P value <10(-12). Sera from 12 out of 12 patients with PDAC stages I, IIA and IIB were blindly validated from controls. Tandem MS/MS identified a cancer phenotype with elements of PDAC involved in early-stage PDAC/control discrimination. These studies indicate electrospray-MS mass profiling can detect serum changes in patients with pancreatitis or early-stage pancreatic cancer. Such technology has the potential to aid in early detection of pancreatic cancer, biomarker development, and in monitoring development of pancreatitis into PDAC.

Keywords: Cancer phenotype; Chronic pancreatitis; Early detection; Electrospray mass spectrometry; Pancreatic ductal adenocarcinoma; Serum mass profiling.


Figures

Fig. 1
Fig. 1
Histology of human pancreas tissue and electrospray MS m/Z serum peaks with analysis. Tissues are as follows: Control (Panel A), chronic pancreatitis (B), and (C) stage IIB pancreatic cancer. Hematoxylin and eosin (H&E) staining was performed as described in Materials and Methods. Demarcations and annotations are described in the Results. ESI-MS was performed as described in Materials and Methods. Panel D, flowchart of ESI-MS serum mass profiling. Panel E, electrospray MS methodology used to identify, quantify, and classify significant sera m/Z peaks into pancreatic cancer (PDAC) or non-cancer control descriptors; mass peak areas are averages from 6 individual serum samples per category.
Fig. 2
Fig. 2
Distinguishing sera between early-stage PDAC patients and control individuals using ESI-MS mass profiling. Panel A, distribution difference between stage IIB PDAC patients versus sera of control individuals based on significant “% PDAC stage IIB patient serum peaks” using the mass peak analyses described in the Materials and Methods and Fig. 1D. Panel B, distribution analysis of the PDAC IIB versus control training database used in Table 3, panel I. Panel C, distribution analysis of the random p value obtained from panel B. Panel D, distinguishing PDAC stage I + IIA patient sera from stage IIB patient sera.
Fig. 3
Fig. 3
ESI-MS analysis discriminating sera from patients with pancreatitis from control individuals and from patients with early-stage PDAC. Panel A, serum sample distribution difference based on “% pancreatitis patient serum peaks” between CP patients and controls using the mass peak analyses described in Fig. 2 legend. Panel B, distinguishing CP patient serum from PDAC stage IIB patient serum. Panel C, distribution analysis of sera from CP patients versus control individuals for the training database used in validation experiments exhibited in Table 3, panel I. Panel D, distinguishing sera from patients with PDAC or CP, and control individuals.
Fig. 4
Fig. 4
Discriminating sera from early-stage PDAC patients, CP patients, stage I lung cancer patients, and from control individuals. Panel A, mass peaks are averages from 5 individual serum samples per category. Panel B, distinguishing sera of PDAC stage I + IIA patients, CP patients, stage I lung cancer patients, and control individuals based on significant “% PDAC patient serum peaks”. Panel C, test metrics (described in Materials and Methods) for data in panel B.

References

    1. American Cancer Society . Cancer Facts & Figures 2013. American Cancer Society; Atlanta: 2013.
    1. Jones S, Zhang X, Parsons DW, Lin JD, Leary RJ, Angenendt P, et al. Core signaling pathways in human pancreatic cancers revealed by global genomic analyses. Science. 2008;321:1801–1806. - PMC - PubMed
    1. Gattani AM, Mandeli J, Bruckner HW. Tumor markers in patients with pancreatic carcinoma. Cancer. 1996;78:57–62. - PubMed
    1. Wang J, Chen J, Chang P, LeBlanc A, Li D, Abbruzzesse JL, et al. MicroRNAs in plasma of pancreatic ductal adenocarcinoma patients as novel blood-based biomarkers of disease. Cancer Prev. Res. (Phila.) 2009;2:807–813. - PMC - PubMed
    1. Baker M. MicroRNA profiling: separating signal from noise. Nat. Methods. 2010;7:687–692. - PubMed

Publication types

Substances