

Age at cancer diagnosis for blacks compared with whites in the United States
- PMID: 25638255
- PMCID: PMC4326308
- DOI: 10.1093/jnci/dju489
Age at cancer diagnosis for blacks compared with whites in the United States
Abstract
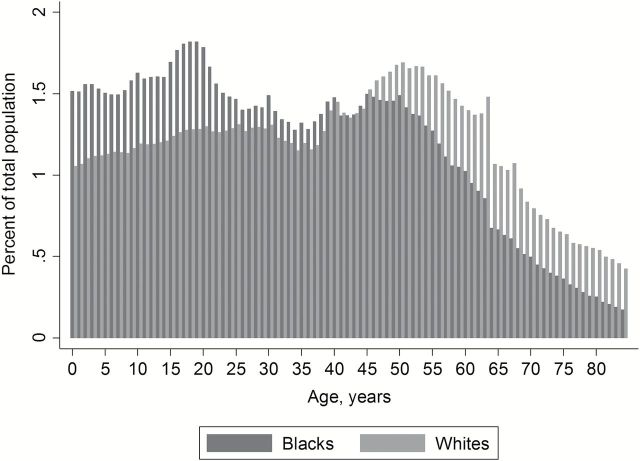
Background: Younger ages at diagnosis for blacks compared with whites have been reported for several cancer types. However, the US black population is younger than the white population, which may bias age comparisons that do not account for the populations at risk.
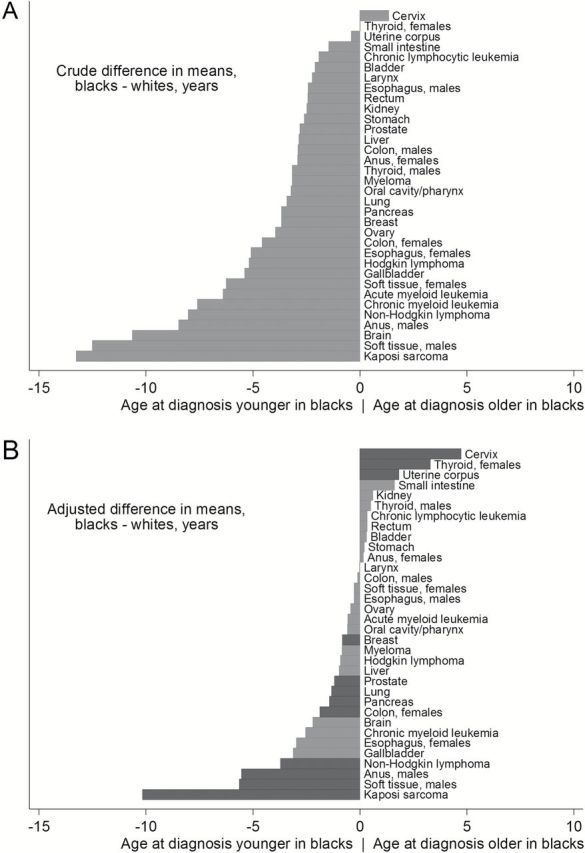
Methods: We analyzed Surveillance, Epidemiology, and End Results data for non-Hispanic blacks and non-Hispanic whites from 18 regions for the year 2010. We calculated crude mean ages at diagnosis among cases of 29 cancer types for whites and blacks. Separately, we calculated adjusted means that corrected for differences in population structure, which we obtained by fitting linear regression models to the ages at diagnosis with statistical weights specific to age and sex. Negative differences indicate younger ages in blacks, while positive differences indicate older ages in blacks. All statistical tests were two-sided.
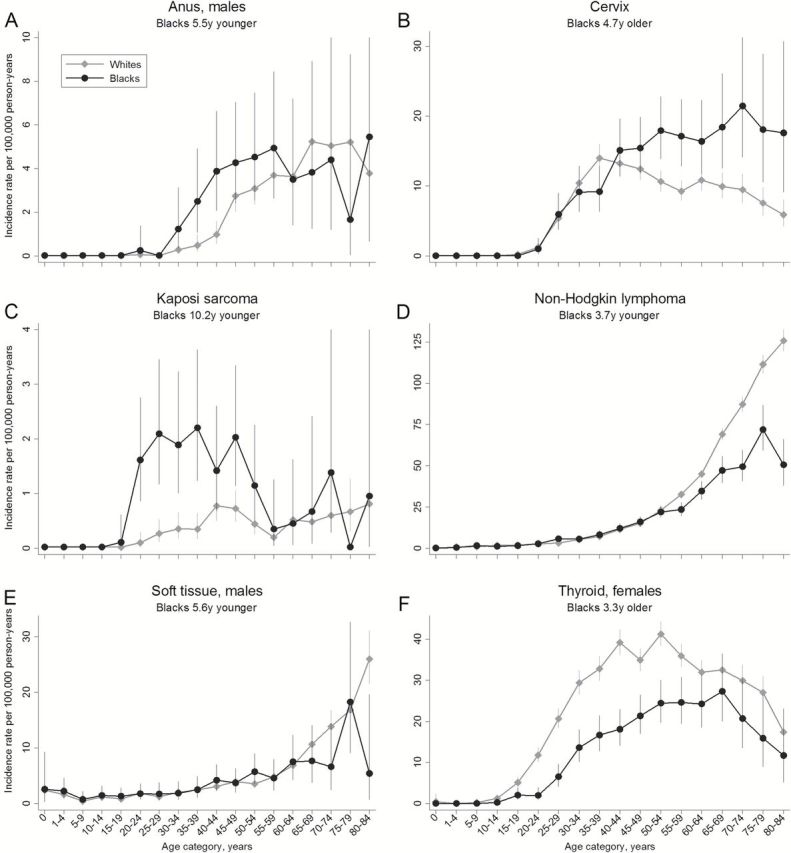
Results: Based on crude means, blacks were diagnosed at younger ages than whites for nearly every cancer type. However, adjustment for population structure shifted the comparisons toward older ages among blacks, and only six statistically significant differences of three or more years remained. Blacks were younger than whites at diagnosis for Kaposi sarcoma (-10.2 years), male soft tissue cancer (-5.6), male anal cancer (-5.5), and non-Hodgkin's lymphoma (-3.7), but older for cervical cancer (+4.7 years) and female thyroid cancer (+3.3). Smaller differences (<3 years) were present for female breast, female colon, lung, pancreas, prostate, and uterine corpus cancers (all P ≤ .001).
Conclusions: Most differences between blacks and whites in the age at cancer diagnosis are small. Large differences for a few cancer types may be driven by etiologic and subtype heterogeneity as well as disparities in access to care.
© Published by Oxford University Press 2015.
Figures
References
-
- Ward E, Jemal A, Cokkinides V, et al. Cancer disparities by race/ethnicity and socioeconomic status. CA Cancer J Clin. 2004;54(2):78–93. - PubMed
-
- Howlader N, Noone AM, Krapcho M, et al. SEER Cancer Statistics Review, 1975–2010, National Cancer Institute; Bethesda, MD: http://seer.cancer.gov/csr/1975_2010/ Accessed April 1, 2013.
-
- American Cancer Society. Cancer Facts & Figures for African Americans 2013–2014. 2013. Atlanta, American Cancer Society.
-
- Joslyn SA, West MM. Racial differences in breast carcinoma survival. Cancer. 2000;88(1):114–123. - PubMed
-
- El-Tamer MB, Wait RB. Age at presentation of African-American and Caucasian breast cancer patients. J Am Coll Surg. 1999;188(3):237–240. - PubMed
Publication types
MeSH terms
Grants and funding
LinkOut - more resources
Full Text Sources
Other Literature Sources
