. 2015 Oct 8;34(41):5302-8.
doi: 10.1038/onc.2014.457. Epub 2015 Feb 2.

Diverse roles of STING-dependent signaling on the development of cancer

Affiliations

Diverse roles of STING-dependent signaling on the development of cancer

J Ahn et al. Oncogene. .

Abstract

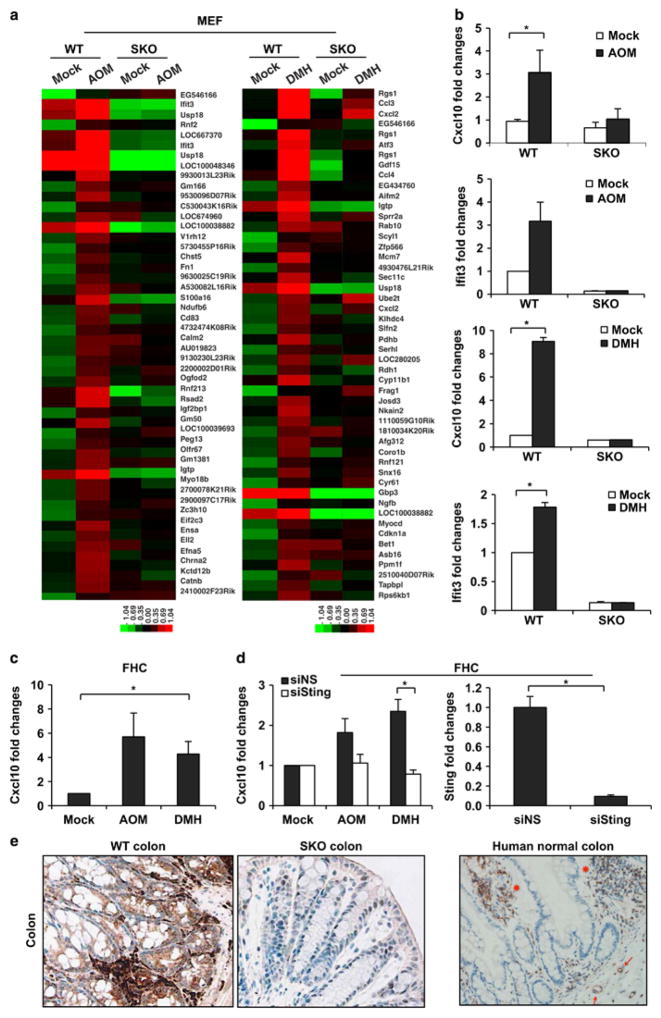
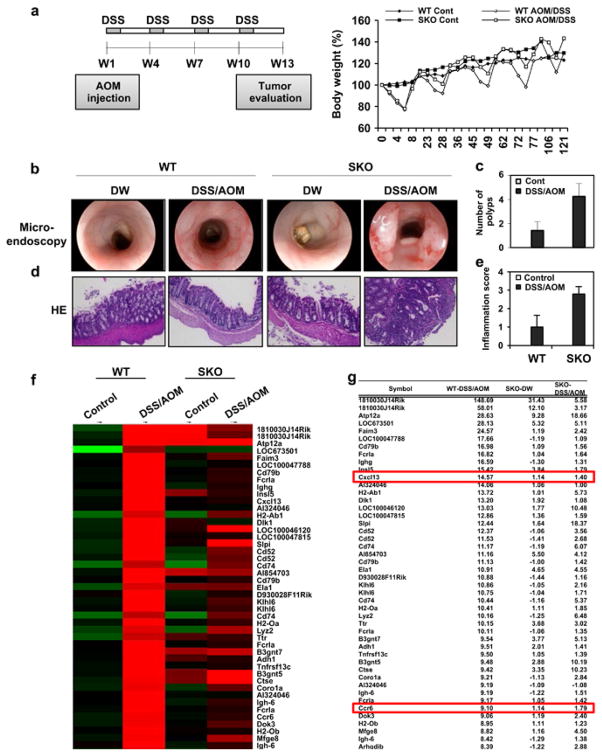
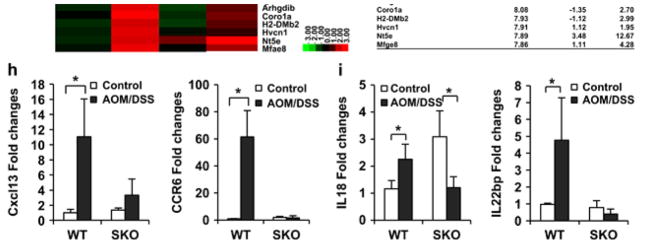
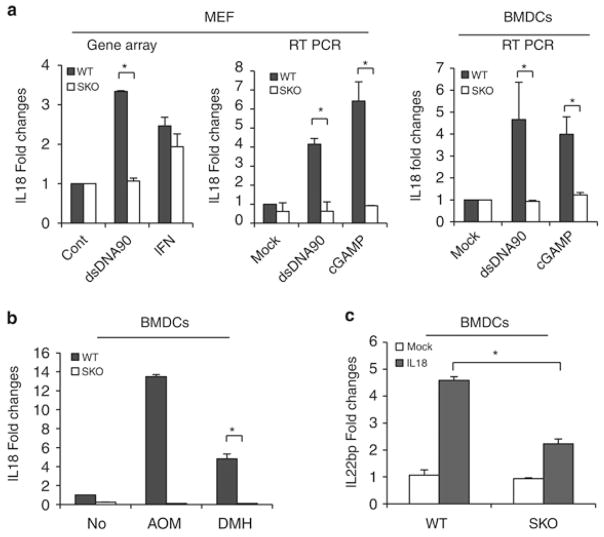
Stimulator of interferon genes (STING) is a cellular sensor that controls cytosolic DNA-activated innate immune signaling. We have previously demonstrated that STING-deficient mice are resistant to carcinogen-induced skin cancer, similar to myeloid differentiation primary response gene 88 (MyD88) deficient mice, since the production of STING-dependent DNA-damage-induced proinflammatory cytokines, that likely require MyD88 signaling to exert their growth-promoting activity, are prevented. In contrast, MyD88-deficient mice are sensitive to colitis-associated cancer (CAC), since selected cytokines generated following DNA-damage also activate repair pathways, which can help prevent tumor development. Here, we demonstrate that STING signaling facilitates wound repair processes and that analogous to MyD88-deficient mice, STING-deficient mice (SKO) are prone to CAC induced by DNA-damaging agents. SKO mice harboring tumors exhibited low levels of tumor-suppressive interleukin-22 binding protein (IL-22BP) compared to normal mice, a cytokine considered critical for preventing colon-related cancer. Our data indicate that STING constitutes a critical component of the host early response to intestinal damage and is essential for invigorating tissue repair pathways that may help prevent tumorigenesis.


Conflict of interest statement

The authors declare no conflict of interest.

Figures

Figure 1
Figure 1
Activation of STING-dependent genes by AOM. (a) Gene array analysis of wild-type (WT) and STING-deficient (SKO) mouse embryonic fibroblasts (MEFs) treated with AOM at 0.14 mM for 8 h (left) and DMH at 1 mM for 8 h (right). MEFs were obtained from embryos from WT and SKO mice at embryonic 15 days by a standard procedure as described (Ishikawa 2008). Gene array analysis was examined by Illumina Sentrix BeadChip array (Mouse WG6 version 2). Highest variable genes are shown. Rows represent individual genes and columns represent individual samples. Pseudo-colors indicate transcript levels below (green), equal to (black) or above (red) the mean. Scale represents the intensity of gene expression (log2 scale ranges between – 2.4 and 2.4). (b) Quantitative real-time PCR analysis (qPCR) of Cxcl10 and Ifit3 in MEFs treated with AOM and DMH same as a. Total RNA was reverse transcribed using moloney murine leukemia virus (M-MLV) reverse transcriptase. qPCR was performed using TaqMan gene expression assay (Cxcl10: Mm00445235, Ifit3: Mm0170846). (c) qPCR analysis of Cxcl10 in human epithelial cell (FHC) treated with AOM and DMH at 1 mM for 24 h. (d) FHCs were transfected with STING or control siRNA for 72 h followed by AOM and DMH treatment same as c, and were then subjected to Cxcl10 mRNA expression (left). STING expression level after siRNA treatment was determined by qPCR (right). Data are representative of at least two independent experiments. Error bars indicate s.d. *P<0.05, Student’s t-test. (e) Immunohistochemistry staining of the colon tissue from WT and SKO mice (left) and human (right). All images were shown at original magnification, x200.
Figure 2
Figure 2
Loss of STING renders mice susceptible to CAC. (a) Schematic representation and body weight of AOM/DSS-induced colitis model. WT (n = 7) and SKO (n = 7) mice (B6;129 mix) were intravenously injected with AOM at a dose 10 mg/kg. After 1 day, mice were fed 5% DSS in drinking water for 7 days. This cycle was repeated four times. Normal drinking water was used for control group. At 91 days, micro-endoscopic procedure was performed in a blinded manner for counting number of polyps. Mice were killed at day 121 and the colon was resected, flushed with phosphate-buffered saline, fixed in formalin for histology or froze for RNA expression analysis. Representative photographs of macro-endoscopic colon tumors (b) and number of polyps (c). Hematoxylin and eosin staining (d) of WT (n = 7) and SKO (n = 7) mice either AOM/DSS treated or normal water treated and inflammation score (0: normal to 3: most severe; e). (f) Gene array analysis of normal tissue (control) and tumor tissue (DSS/AOM) from WT and SKO mice treated same as a. Rows represent individual genes and columns represent individual samples. Pseudo-colors indicate transcript levels below (green), equal to (black) or above (red) the mean. Scale represents the intensity of gene expression (log2 scale ranges between – 2.4 and 2.4). (g) Highest variable gene lists are shown. (h) qPCR of Cxcl13 and Ccr6 in normal tissue (control) and tumor tissue (DSS/AOM) from WT and SKO mice treated same as a. (i) qPCR analysis of IL-18 and IL-22BP (IL-18: Mm00434225, IL-22BP: Mm01192969) from normal tissue (control) and tumor tissue (DSS/AOM) from WT and SKO mice. Data are the mean of at least five mice. Error bars indicate s.d. *P<0.05, Student’s t-test.
Figure 2
Figure 2
Loss of STING renders mice susceptible to CAC. (a) Schematic representation and body weight of AOM/DSS-induced colitis model. WT (n = 7) and SKO (n = 7) mice (B6;129 mix) were intravenously injected with AOM at a dose 10 mg/kg. After 1 day, mice were fed 5% DSS in drinking water for 7 days. This cycle was repeated four times. Normal drinking water was used for control group. At 91 days, micro-endoscopic procedure was performed in a blinded manner for counting number of polyps. Mice were killed at day 121 and the colon was resected, flushed with phosphate-buffered saline, fixed in formalin for histology or froze for RNA expression analysis. Representative photographs of macro-endoscopic colon tumors (b) and number of polyps (c). Hematoxylin and eosin staining (d) of WT (n = 7) and SKO (n = 7) mice either AOM/DSS treated or normal water treated and inflammation score (0: normal to 3: most severe; e). (f) Gene array analysis of normal tissue (control) and tumor tissue (DSS/AOM) from WT and SKO mice treated same as a. Rows represent individual genes and columns represent individual samples. Pseudo-colors indicate transcript levels below (green), equal to (black) or above (red) the mean. Scale represents the intensity of gene expression (log2 scale ranges between – 2.4 and 2.4). (g) Highest variable gene lists are shown. (h) qPCR of Cxcl13 and Ccr6 in normal tissue (control) and tumor tissue (DSS/AOM) from WT and SKO mice treated same as a. (i) qPCR analysis of IL-18 and IL-22BP (IL-18: Mm00434225, IL-22BP: Mm01192969) from normal tissue (control) and tumor tissue (DSS/AOM) from WT and SKO mice. Data are the mean of at least five mice. Error bars indicate s.d. *P<0.05, Student’s t-test.
Figure 3
Figure 3
IL-18 controls IL-22BP in STING-dependent manner. (a) Fold changes from gene array analysis of IL-18 in WT and SKO MEFs administered with 4 ug/ml of dsDNA90 and IFNβ for 8 h (left). qPCR analysis of IL18 in WT and SKO MEFs, and bone marrow-derived dendritic cells (BMDCs) transfected with 4 μg/ml of dsDNA90 and cyclic-di-GMP-AMP (cGAMP) for 8 h (middle). (b) qPCR analysis of IL-18 in WT and SKO BMDCs with 1 mM of AOM and 1 mM of DMH for 8 h. (c) qPCR analysis of IL-22BP in WT and SKO BMDCs treated with 10 ng/ml of recombinant mouse IL-18 protein (MBL B002-5) for 24 h. Total RNA was reverse transcribed using M-MLV reverse transcriptase. qPCR was performed using TaqMan gene expression assay (IL-18: Mm00434225, IL-22BP: Mm01192969). Data are the mean of at least five mice. Error bars indicate s.d. *P<0.05, Student’s t-test.

Similar articles

Cited by

References

    1. Goldszmid RS, Trinchieri G. The price of immunity. Nat Immunol. 2012;13:932–938. - PubMed
    1. Nowarski R, Gagliani N, Huber S, Flavell RA. Innate immune cells in inflammation and cancer. Cancer Immunol Res. 2013;1:77–84. - PubMed
    1. Cataisson C, Salcedo R, Hakim S, Moffitt BA, Wright L, Yi M, et al. IL-1R-MyD88 signaling in keratinocyte transformation and carcinogenesis. J Exp Med. 2012;209:1689–1702. - PMC - PubMed
    1. Ishikawa H, Ma Z, Barber GN. STING regulates intracellular DNA-mediated, type I interferon-dependent innate immunity. Nature. 2009;461:788–792. - PMC - PubMed
    1. Burdette DL, Monroe KM, Sotelo-Troha K, Iwig JS, Eckert B, Hyodo M, et al. STING is a direct innate immune sensor of cyclic di-GMP. Nature. 2011;478:515–518. - PMC - PubMed