

doi: 10.1002/adma.201404677.
Epub 2015 Jan 15.
Tunable nanostructured coating for the capture and selective release of viable circulating tumor cells
Affiliations
- PMID: 25640006
- PMCID: PMC4492283
- DOI: 10.1002/adma.201404677
Item in Clipboard
Tunable nanostructured coating for the capture and selective release of viable circulating tumor cells
Adv Mater.
.
Abstract
A layer-by-layer gelatin nanocoating is presented for use as a tunable, dual response biomaterial for the capture and release of circulating tumor cells (CTCs) from cancer patient blood. The entire nanocoating can be dissolved from the surface of microfluidic devices through biologically compatible temperature shifts. Alternatively, individual CTCs can be released through locally applied mechanical stress.
Keywords: circulating tumor cells; circulating tumor clusters; microfluidics; nanostructured coatings; single cell sequencing.
© 2015 WILEY-VCH Verlag GmbH & Co. KGaA, Weinheim.
Figures
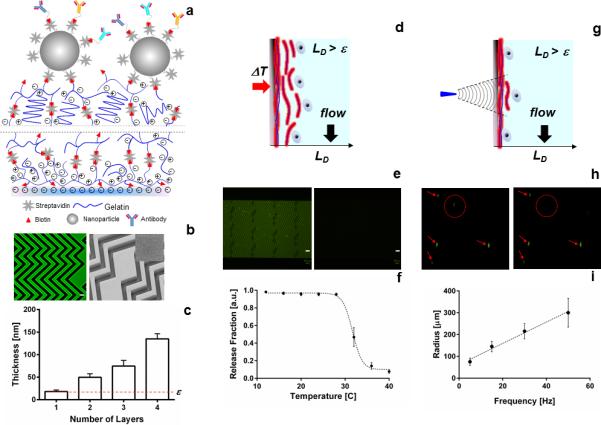
(a) Schematic of the modified LBL nanocoating at the surface of a microfluidic device. Lines indicate the process is repeated four times. (b) Left, confocal micrograph of the nanocoating using streptavidin-FITC; right, electron microscopy image of the coating with the insert showing a high-resolution imaging of the surface, scale bar represents 50 μm. (c) Thickness-growth curve of the deposited layers. (d) Cartoon of the bulk release mechanism for the nanocoating. (e) Fluorescence microscopy images of the coating before (left) and after degradation, scale bar represents 200 μm. (f) Quantification of the release fraction of microbeads immobilized on the surface of the nanocoating. (g) Cartoon of the single cell / selective release mechanism. (h) Micrographs of a single cell being released from the nanocoating. In the left image, the cell targeted for release is identified with a dotted red circle; all other cells that should remain are marked with red arrows. The right image was taken after applying localized shear stress with our microtip, releasing only the target cell. (i) Size of the release radius based on the magnitude of the frequency of vibration of the microtip.
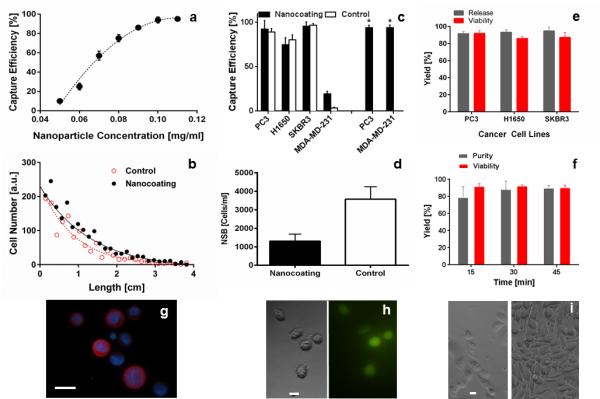
(a) Effect of nanoparticle concentration on cell capture. Prostate cancer cells (PC3s) were spiked into whole blood at 1000 cells/ml to determine the capture efficiency (b) Plotting the location of target cell capture on the microfluidic device reveals a distinct decay pattern, indicating the specificity of capture (Figure S8). (c) Cell capture efficiency for different cancer cell lines. PC3 and MDA-MD-231 cells were captured on the nanocoating functionalized with anti-EpCAM (black bars = nanocoating, white bars = control chemistry), or our antibody cocktail (black bars with *). (d) Quantification of non-specific binding (NSB) of contaminating leukocytes on the nanocoating. (e) Comparison of release efficiency and viability for different cancer cell lines using the temperature degradation mechanism of the nanocoating. (f) Quantification of viability and purity of PC3 cells released from the nanocoating using the selective, single cell release mechanism. 15 cells were released at each time point in a sequential manner (n = 3). (g) Immunofluorescence microscopy image of released PC3 cells on a glass slide (see Supporting Information for a list of antibodies, scale bar 20 μm). (h) Bright field and fluorescent micrographs of released cells, cultured for 6 hours post-release (scale bar 10μm). (i) Micrographs of released cells, 3 days (left) and 7 days (right) post-release (scale bar 10 μm).
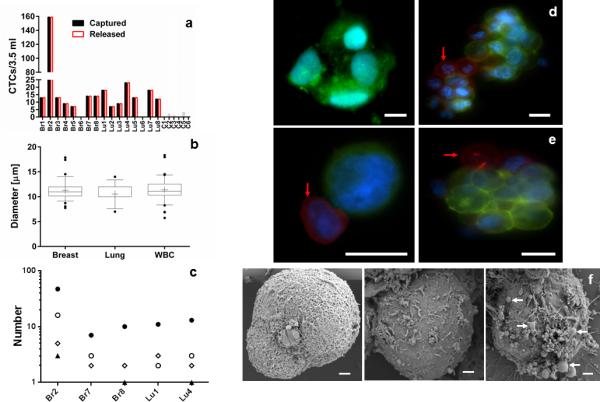
(a) Enumeration of patient CTCs captured (black bars) and released (white bars) from the nanocoating. Breast (Br#) and Lung (Lu#) cancer patients were analyzed along with healthy donors (C#). (b) Size comparison between single CTCs and white blood cells (WBC) from patient samples. Cell diameter was calculated from the area values obtained from stained cells. (c) Frequency distribution for single, doublet, triplet and CTC cluster capture for five patients. The population of isolated CTCs were grouped and quantified in four categories: Single (•), double (ο), triple (▲), and cluster (◊) of CTCs. (d) Micrographs of clusters of CTCs captured on the nanocoating from lung (left) and breast (right) cancer patients. (e) Micrographs of CTCs from a breast cancer patient released from the nanocoating. Red arrows indicate WBCs within single or cluster of CTCs (scale bar 10 μm). (f) Scanning electron microscopy image of breast cancer CTCs of the same patient. The images revealed a heterogeneous surface morphology with the presence of membrane ruffles and in some cases extracellular vesicles (white arrows).
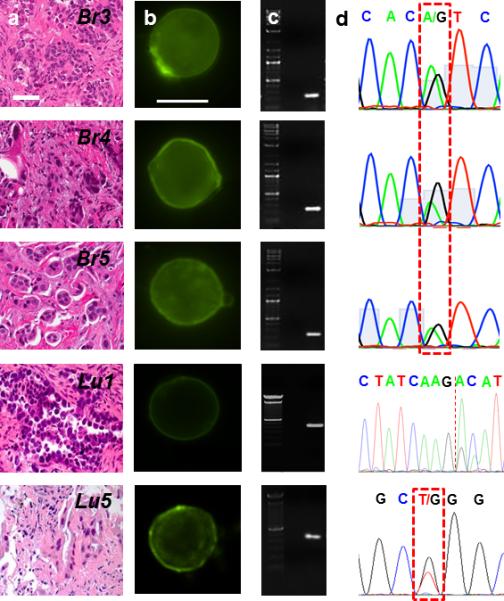
(a) H & E staining of the primary tumor of metastatic breast and lung cancer patients. Tissue biopsies were used to determine the presence of DNA mutations on the oncogene PIK3CA and EGFR. (b) Panel of CTCs from the same metastatic breast and lung cancer patients in (a). Micrographs of the CTCs identified and subsequently released for molecular analysis using our selective release mechanism (scale bar 10 μm). (c) Micrographs of amplified DNA of the single CTCs shown in (b). (d) Sequencing of the amplified DNA from the single CTCs shown in (b). The 3140A/G (H1047R) point mutation in the PIK3CA oncogene as well as the exon 19 deletion and the 2573T/G (L858R) point mutation in the EGFR oncogene were detected at the single cell level.
References
-
- Cristofanilli M, Budd GT, Ellis MJ, Stopeck A, Matera J, Miller MC, Reuben JM, Doyle GV, Allard WJ, Terstappen LWMM, Hayes DF. New Engl. J. Med. 2004;351:781. - PubMed
-
- Powell AA, Talasaz AH, Zhang H, Coram MA, Reddy A, Deng G, Telli ML, Advani RH, Carlson RW, Mollick JA, Sheth S, Kurian AW, Ford JM, Jeffrey SS. Plos One. 2012;7:33788. - PMC - PubMed
- Ozkumur E, Shah AM, Ciciliano JC, Emmink BL, Miyamoto DT, Brachtel E, Yu M, Chen P.-i., Morgan B, Trautwein J, Kimura A, Sengupta S, Stott SL, Karabacak NM, Barber TA, Walsh JR, Smith K, Spuhler PS, Sullivan JP, Lee RJ, Ting DT, Luo X, Shaw AT, Bardia A, Sequist LV, Louis DN, Maheswaran S, Kapur R, Haber DA, Toner M. Sci. Transl. Med. 2013;5:179ra47. 1. - PMC - PubMed
Publication types
MeSH terms
Substances
Grants and funding
LinkOut - more resources
Full Text Sources
Other Literature Sources
