. 2015 Feb;14(2):158-66.
doi: 10.1111/gbb.12201. Epub 2015 Mar 5.

Aggression is associated with aerobic glycolysis in the honey bee brain(1)

Affiliations

Aggression is associated with aerobic glycolysis in the honey bee brain(1)

S Chandrasekaran et al. Genes Brain Behav. 2015 Feb.

Abstract

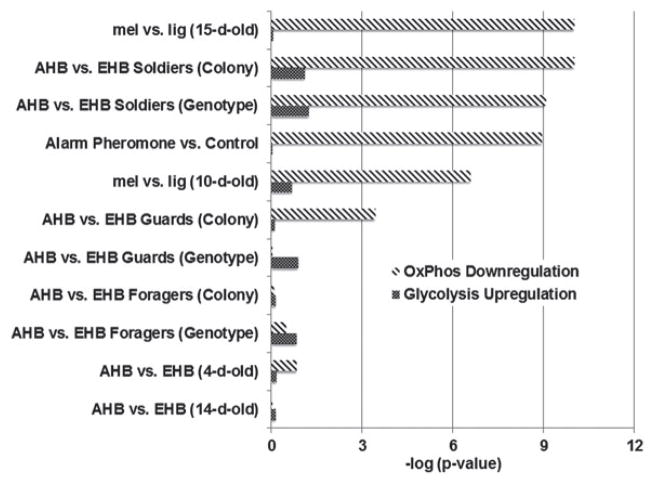
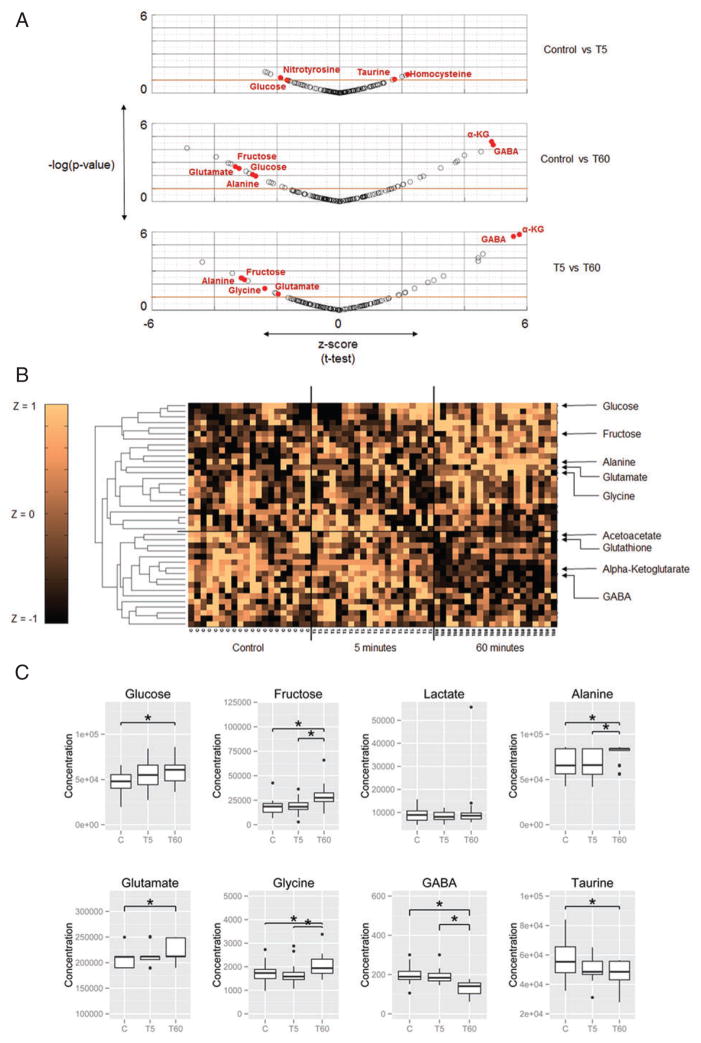
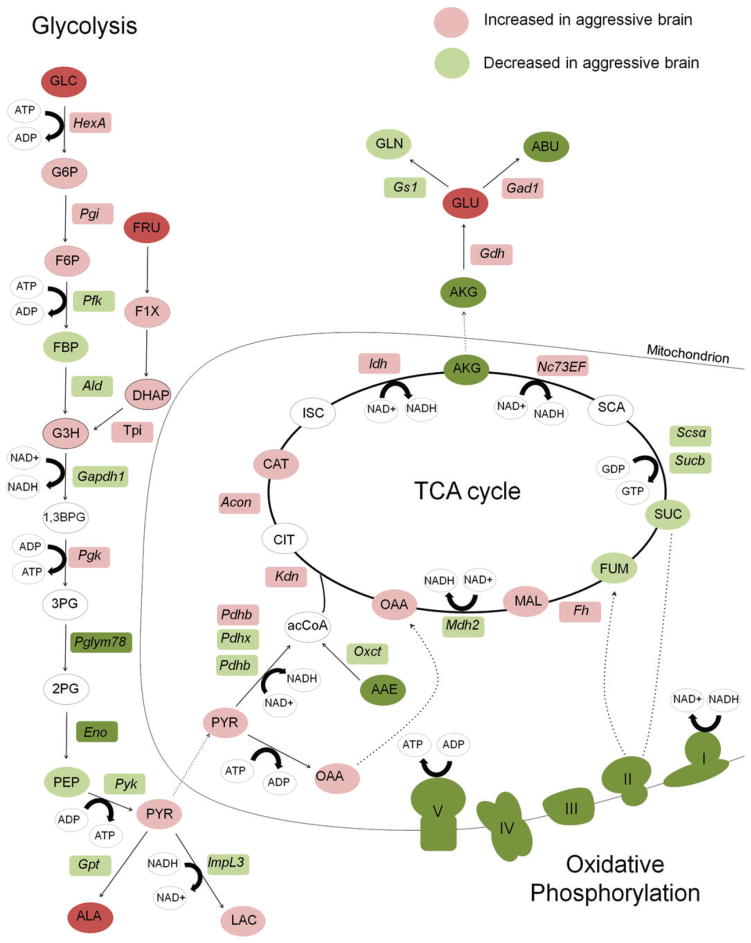
Aerobic glycolysis involves increased glycolysis and decreased oxidative catabolism of glucose even in the presence of an ample oxygen supply. Aerobic glycolysis, a common metabolic pattern in cancer cells, was recently discovered in both the healthy and diseased human brain, but its functional significance is not understood. This metabolic pattern in the brain is surprising because it results in decreased efficiency of adenosine triphosphate (ATP) production in a tissue with high energetic demands. We report that highly aggressive honey bees (Apis mellifera) show a brain transcriptomic and metabolic state consistent with aerobic glycolysis, i.e. increased glycolysis in combination with decreased oxidative phosphorylation. Furthermore, exposure to alarm pheromone, which provokes aggression, causes a metabolic shift to aerobic glycolysis in the bee brain. We hypothesize that this metabolic state, which is associated with altered neurotransmitter levels, increased glycolytically derived ATP and a reduced cellular redox state, may lead to increased neuronal excitability and oxidative stress in the brain. Our analysis provides evidence for a robust, distinct and persistent brain metabolic response to aggression-inducing social cues. This finding for the first time associates aerobic glycolysis with naturally occurring behavioral plasticity, which has important implications for understanding both healthy and diseased brain function.

Keywords: Aerobic glycolysis; aggression; brain metabolism; metabolomics; neurogenomics; transcriptomics.


Figures

Figure 1
Figure 1. Differential expression of glycolysis and OXPhos genes in the aggressive brain
Each category, described in Table 1, compares genetic and socially induced differences in aggression; all comparisons involve a more aggressive vs. a less aggressive state. AHB, Africanized honey bee (hybrids of Apis mellifera ligustica and scutellata); EHB, European honey bee (primarily Apis mellifera ligustica); lig, Apis mellifera ligustica; mel, Apis mellifera mellifera. ‘Colony’ label indicates effects of colony genotype on gene expression, independent of individual genotype (cross-fostering design). P-values based on hypergeometric test of enrichment are shown (Materials and methods). The P-value for mel v. lig. (15-day-old) was floored to 10−10 for visual clarity.
Figure 2
Figure 2. Metabolomics data
(a) Scatter plot of z-scores and P-values of all measured metabolites. Scatter plot shows differentially expressed metabolites and outliers between Control individuals and individuals 5 or 60 min after the start of the aggressive response. Outliers and differentially expressed metabolites (P-value < 0.05) mentioned in the text are highlighted. Metabolites above the red line (P-value < 0.1) are plotted in the clustergram in (b). Abbreviations: Alpha-ketoglutarate –αKG, Gamma-Amino Butryic Acid – GABA. (b) Unsupervised hierarchical clustering of metabolite levels in the aggressive brain. Clustergram shows differentially expressed (P < 0.1; t-test) metabolite levels (standardized to z-scores with zero mean and unit variance to enable comparison across metabolites) across the 60 samples from Control individuals and individuals 5 or 60 min after the start of the aggressive response. The horizontal line separates upregulated from downregulated metabolites at 60 min. (c) Levels of key metabolites connected to AG. Glucose and fructose are energy substrates, and lactate and alanine are end products of AG. The bottom row shows levels of excitatory and inhibitory neurotransmitters connected to AG. Asterisks indicate significant differences (P < 0.05). Refer to Figure S3 and Table S2 for full list of metabolite labels and P-values.
Figure 3
Figure 3. Relative levels of central metabolism metabolites and genes in the aggressive brain
Metabolites are listed in circles and genes are in rectangles. Metabolites in white were not measured. Dark green and dark red colors represent changes in metabolites and mRNA that were statistically significant (a decrease or increase, respectively) according to gene expression and metabolite data from honey bees treated with alarm pheromone vs. control. Light green and light red colors represent a non-significant decrease or increase, respectively. Protein complexes in the oxidative phosphorylation pathway, which are composed of variable numbers of protein subunits, are drawn as cartoons that represent the physical shapes of the complexes. Complexes are colored green to represent the general down regulation of the transcripts that encode protein constituents. Circles with black and dotted borders were compounds that were indistinguishable from one another in the metabolomics analysis. GLC, glucose; PYR, pyruvate; OAA, oxaloacetate; CIT, citrate; AKG, alpha-ketoglutarate; SUC, succinate; FUM, fumarate; MAL, malate; SCA, succinyl-CoA; GLU, glutamate; GLN, glutamine; LAC, lactate; ALA, alanine; G6P, glucose 6 phosphate; F6P, fructose 6 phosphate; FBP, fructose 1,6 bis phosphate; GADP, glyceraldehyde 3 phosphate; DHAP, dihydroxyacetone phosphate; 1,3BPG, 1,3 bisphosphoglycerate; 3PG, 3 phosphoglycerate; 2PG, 2 phosphoglycerate; PEP, phosphoenolpyruvate.

References

    1. Agathocleous M, Love NK, Randlett O, Harris JJ, Liu J, Murray AJ, Harris WA. Metabolic differentiation in the embryonic retina. Nat Cell Biol. 2012;14:859–864. - PMC - PubMed
    1. Alaux C, Sinha S, Hasadsri L, Hunt GJ, Guzman-Novoa E, DeGrandi-Hoffman G, Uribe-Rubio JL, Southey BR, Rodriguez-Zas S, Robinson GE. Honey bee aggression supports a link between gene regulation and behavioral evolution. Proc Natl Acad Sci USA. 2009;106:15400–15405. - PMC - PubMed
    1. Barros LF. Metabolic signaling by lactate in the brain. Trends Neurosci. 2013;36:396–404. - PubMed
    1. Bergersen LH, Gjedde A. Is lactate a volume transmitter of metabolic states of the brain? Front Neuroenergetics. 2012;4:5. - PMC - PubMed
    1. Boy F, Evans CJ, Edden RA, Lawrence AD, Singh KD, Husain M, Sumner P. Dorsolateral prefrontal gamma-aminobutyric acid in men predicts individual differences in rash impulsivity. Biol Psychiatry. 2011;70:866–872. - PMC - PubMed

Publication types

LinkOut - more resources