. 2015 Feb 2:5:8183.
doi: 10.1038/srep08183.

Identifying anti-growth factors for human cancer cell lines through genome-scale metabolic modeling

Affiliations

Identifying anti-growth factors for human cancer cell lines through genome-scale metabolic modeling

Pouyan Ghaffari et al. Sci Rep. .

Abstract

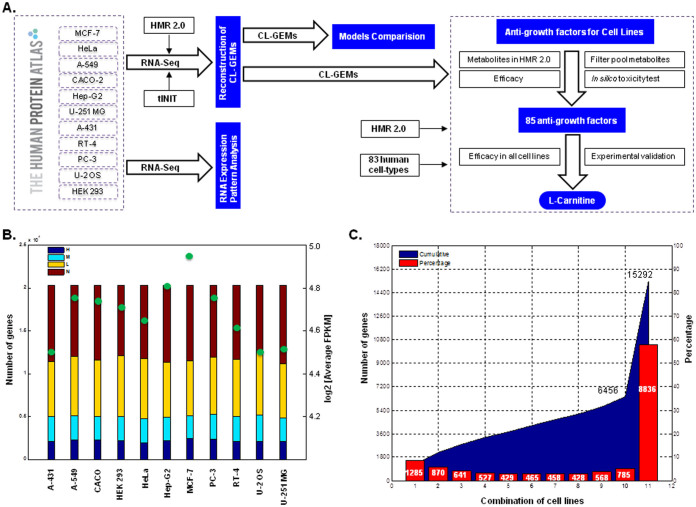
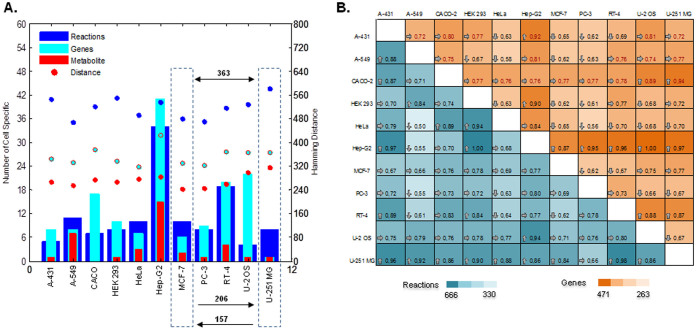
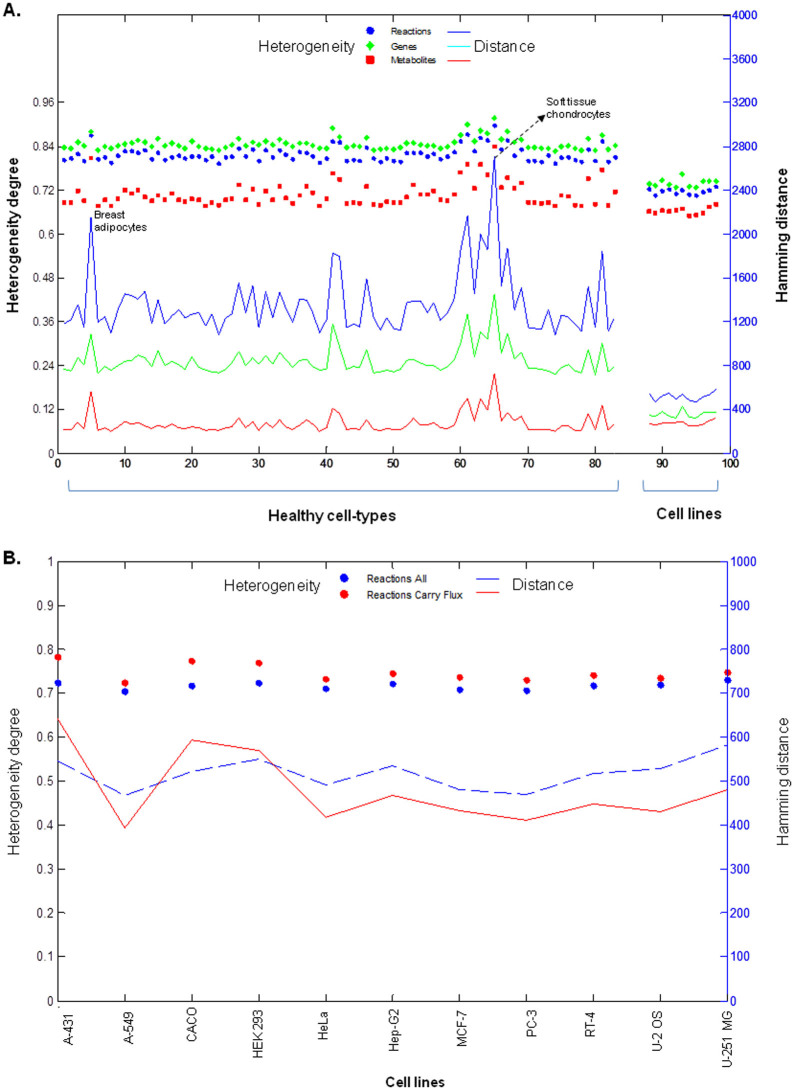
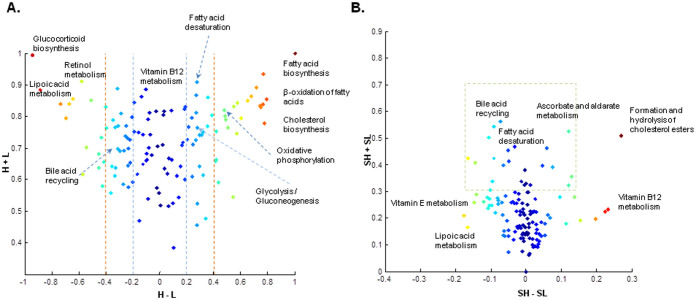
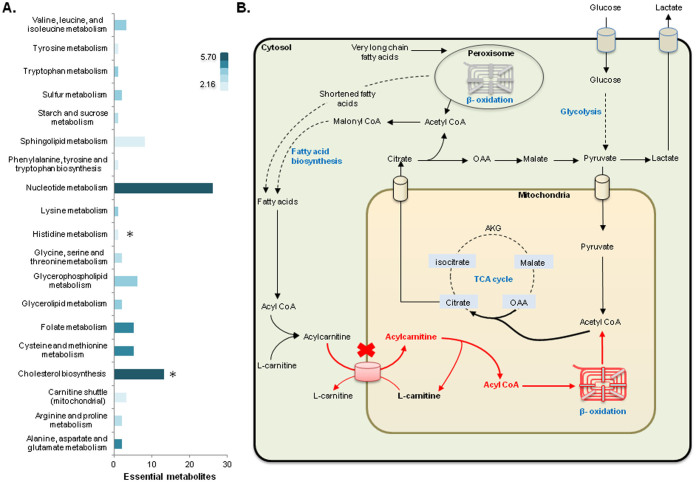
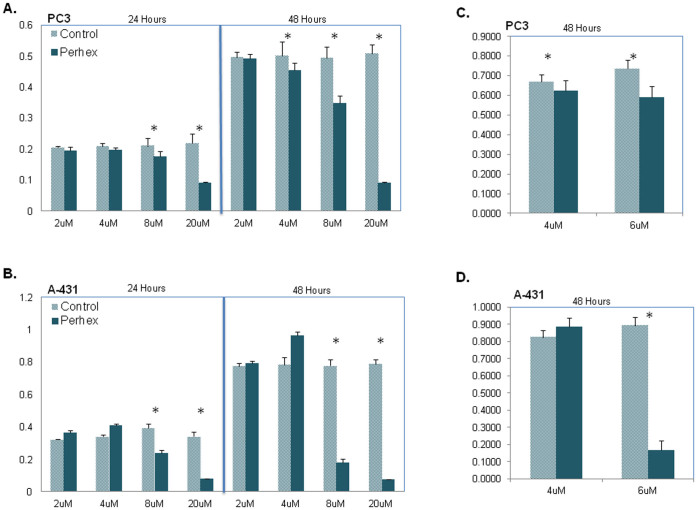
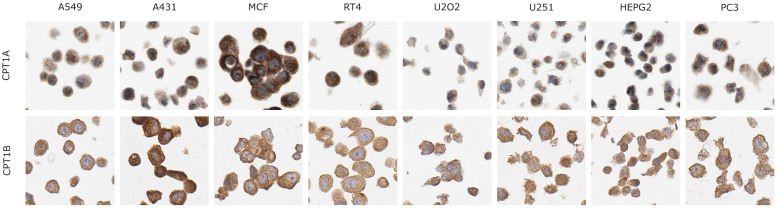
Human cancer cell lines are used as important model systems to study molecular mechanisms associated with tumor growth, hereunder how genomic and biological heterogeneity found in primary tumors affect cellular phenotypes. We reconstructed Genome scale metabolic models (GEMs) for eleven cell lines based on RNA-Seq data and validated the functionality of these models with data from metabolite profiling. We used cell line-specific GEMs to analyze the differences in the metabolism of cancer cell lines, and to explore the heterogeneous expression of the metabolic subsystems. Furthermore, we predicted 85 antimetabolites that can inhibit growth of, or even kill, any of the cell lines, while at the same time not being toxic for 83 different healthy human cell types. 60 of these antimetabolites were found to inhibit growth in all cell lines. Finally, we experimentally validated one of the predicted antimetabolites using two cell lines with different phenotypic origins, and found that it is effective in inhibiting the growth of these cell lines. Using immunohistochemistry, we also showed high or moderate expression levels of proteins targeted by the validated antimetabolite. Identified anti-growth factors for inhibition of cell growth may provide leads for the development of efficient cancer treatment strategies.


Figures

Figure 1
Figure 1. Pipeline for prediction of anti-growth factors using CL-GEMs.
(A) CL-GEMs were reconstructed by introducing RNA expression profile of 20,314 protein coding genes across eleven human cancer cell lines into the HMR2 using the tINIT algorithm. CL-GEMs were used to evaluate all metabolites present in HMR2 and to identify potential anti-growth factors, which were followed by filtering the pool metabolites and analyzing in silico toxicity of predicted targets. Finally, one of the potential anti-growth factors were validated experimentally. (B) Protein coding genes for each cell line were categorized based on the transcript expression levels. Stacked bars represent different expression levels and filled circles shows the average FPKM value in log2 scale. (C) Distribution of 15,292 detected genes across different combination of cell lines are shown. Area curve represents cumulative number of genes through different combinations of cell lines, while bar plots shows the percentage of each combination together with corresponding number of genes inside the bar. 8,836 (~58%) of all detected genes were shared by all cell lines and remaining 42% distributed between different combinations, from which cell specific genes outnumbers the other combinations with 1,285 (~8%) of assigned genes.
Figure 2
Figure 2. Differences between the CL-GEMs.
(A) Distribution of cell specific genes, metabolites and reactions across CL-GEMs (bar plots). Filled circles represent average Hamming distance of each CL-GEM compared to other models. Here, Hamming distance is an indicator of required change to transform one model to the other based on each parameter (Supplementary Dataset 4). For example, 363 changes in genes profiles are required for inter-transformation of metastatic breast adenocarcinoma cell line (MCF-7) and glioblastoma cell line (U-251 MG), from which 206 changes in genes corresponds to transformation of MCF-7 to U-251 MG and 157 changes in genes corresponds to transformation of U-251 MG to MCF-7. (B) Pair wise comparison of CL-GEMs based on genes and reactions. Numbers inside the colored squares represent the ratio of pair wise difference between CL-GEMS compared to maximum observed difference across all models.
Figure 3
Figure 3. The heterogeneity of healthy cell-types and human cancer cell lines.
(A) Heterogeneity degrees of GEMs for 83 healthy cell-types and cancer cell lines are projected on the left hand side axis. There is a relatively low, 0.07 degree, tendency towards uniformity of metabolic networks in cell lines comparing to healthy cell-types. Both GEMs for healthy cell-types and cancer cell lines show higher heterogeneity for genes and reactions compared to metabolites. However, the heterogeneity of models based on metabolites is stable, in contrast to reactions and genes. Hamming distances of GEMs for 83 healthy cell-types and CL-GEMs are projected on the right hand side axis. There is relatively high, ~50%, fall in Hamming distance for cell lines compared to healthy cell-types as result of tremendous dimensional variations, ~4 fold change, in metabolic models of healthy cell-types. In general, models show higher heterogeneity based on genes and larger distance based on reactions. (B) Heterogeneity of flux carrying as well as all reactions in CL-GEMs is shown on the left hand side axis. Hamming distances of CL-GEMs with flux carrying and all reactions are projected on the right hand side axis. Even though the content of the models decreased after removal of non-flux carrying reactions, the heterogeneity of the models was slightly increased.
Figure 4
Figure 4. Metabolic subsystems in CL-GEMs.
(A) Transcriptome expression pattern of metabolic subsystems in CL-GEMs are demonstrated. Metabolic subsystems are shown in H − L and H + L coordinates, where H is the fraction of models in which a subsystem has average high RNA expression level, and L is the fraction of models in which a subsystem has average low RNA expression level. Subsystems with dominantly high expression pattern clustered on the upper right corner of the plot, whereas subsystems with dominantly lower expression pattern occupy position in the upper left corner. Subsystems with heterogeneous behavior across cell lines are placed in the upper middle near zero on horizontal axis. Red dashed lines shows 40% of horizontal expansion and the blue dashed lines represent 20% of horizontal deviation. (B) Inter-cell line variation of heterogeneity in metabolic subsystems are demonstrated. Subsystems are shown in SH − SL and SH + SL coordinates, where for each pathway SH is the standard deviation of high RNA expression level across cell lines, and LH is the standard deviation of low RNA expression level. Subsystems with more variation in high RNA expression level occupy positions in the right-hand side of zero on horizontal axis, whereas subsystems with more variation in low RNA expression level placed in left-hand side of zero on horizontal axis. Subsystems with less expressional variation across cell lines are clustered in the lower part of the plot near zero on the horizontal axis. Heterogeneity mainly happens in the upper and upper right areas within the plot which are marked with dashed lines.
Figure 5
Figure 5. Prediction of antimetabolites through the use of CL-GEMs.
(A) Distribution of 85 predicted antimetabolites and their corresponding metabolic subsystems in HMR2 are presented. Color gradient shows the average RNA expression level of related pathways in log2 scale. Stars indicate the two pathways with highest and lowest expression levels. (B) L-carnitine was predicted as an essential metabolite, and the use of its analogue was proposed for inhibiting the growth in all eleven cell lines. The predicted mechanism of action of an L-carnitine analogue is presented. L-carnitine antimetabolite may reduce β-oxidation and de novo fatty acids synthesis which is required for synthesis of the cell membrane and for cell proliferation. The abbreviations and the detailed explanations for the metabolites as well as the associated genes for each reaction are presented in HMR2.
Figure 6
Figure 6. Inhibitory effect of Perhexiline on the proliferation of cell lines.
Effect of Perhexiline on the proliferation of prostate carcinoma cell line, PC-3 and epidermoid carcinoma cell line, A-431 are shown. Perhexiline was used to mimic the L-carnitine analogue mechanism of effect on the proliferation of PC-3 and A-431 cell lines. (A) PC-3 and (B) A-431 cell lines were treated by 2, 4, 8 and 20 μM of Perhexiline and viability of cells determined after 24 and 48 hours. Perhexiline was dissolved in DMSO, and corresponding concentrations of DMSO in the medium were used as controls. Results of analyzing eight replicates of all concentrations and corresponding controls were represented by bar plots, mean ± standard deviation. Significantly difference between control and treated cell line: * (Student's t-test, p-value < 0.05). (C) PC-3 and (D) A-431 cell lines were treated by 4 and 6 μM of Perhexiline and viability of cells determined after 48 hours. Results of analyzing 16 replicates of two concentrations and corresponding controls were represented by bar plots, mean ± standard deviation. Significantly difference between control and treated cell line: * (Student's t-test, p-value < 0.05).
Figure 7
Figure 7. Protein staining of CPT1 and CPT2 in cell lines.
Protein staining level of CPT1 and CPT2 are shown using the antibodies generated in Human Protein Atlas. Protein expression is seen in brown, counterstaining in blue.

Similar articles

Cited by

References

    1. Jain M. et al. Metabolite Profiling Identifies a Key Role for Glycine in Rapid Cancer Cell Proliferation. Science 336, 1040–1044 (2012). - PMC - PubMed
    1. Moghaddas Gholami A. et al. Global proteome analysis of the NCI-60 cell line panel. Cell Rep 4, 609–620 (2013). - PubMed
    1. Geiger T., Wehner A., Schaab C., Cox J. & Mann M. Comparative proteomic analysis of eleven common cell lines reveals ubiquitous but varying expression of most proteins. Mol Cell Proteomics 11, M111 014050 (2012). - PMC - PubMed
    1. Hyduke D. R., Lewis N. E. & Palsson B. O. Analysis of omics data with genome-scale models of metabolism. Molecular bioSystems 9, 167–174 (2013). - PMC - PubMed
    1. Mardinoglu A. & Nielsen J. Systems medicine and metabolic modelling. Journal of internal medicine 271, 142–154 (2012). - PubMed

Publication types

LinkOut - more resources