. 2015 Feb 2:79:28.9.1-28.9.14.
doi: 10.1002/0471140864.ps2809s79.

Analysis of protein stability and ligand interactions by thermal shift assay

Affiliations

Analysis of protein stability and ligand interactions by thermal shift assay

Kathy Huynh et al. Curr Protoc Protein Sci. .

Abstract

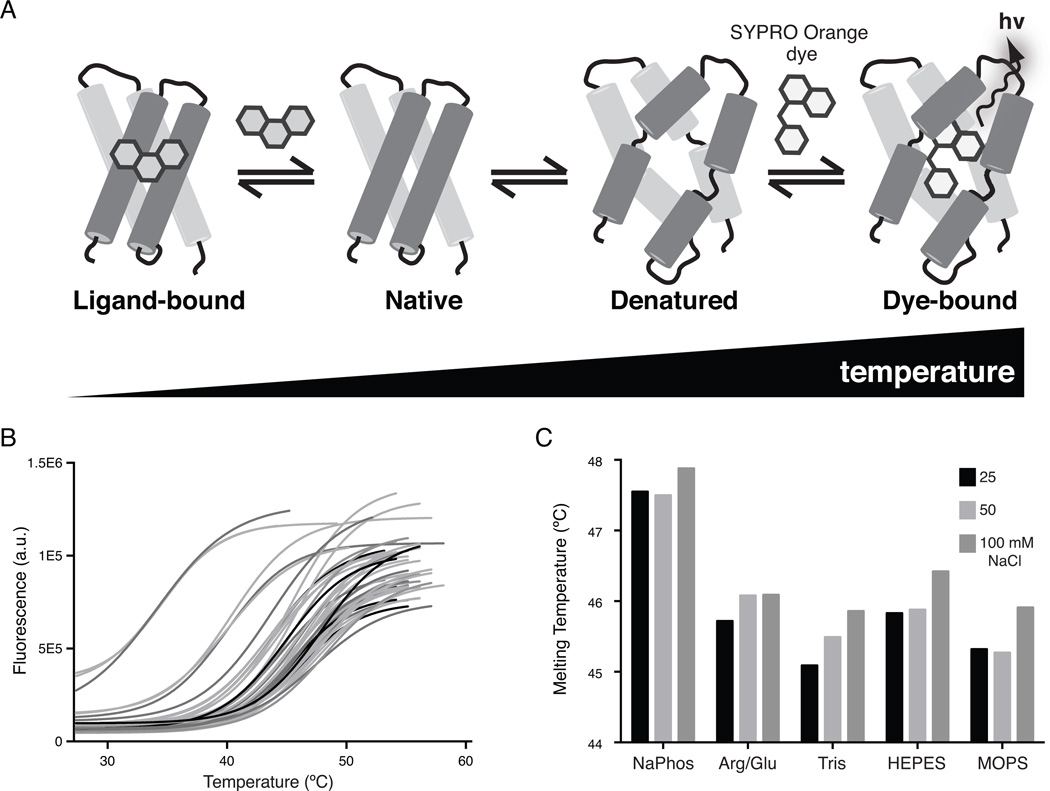
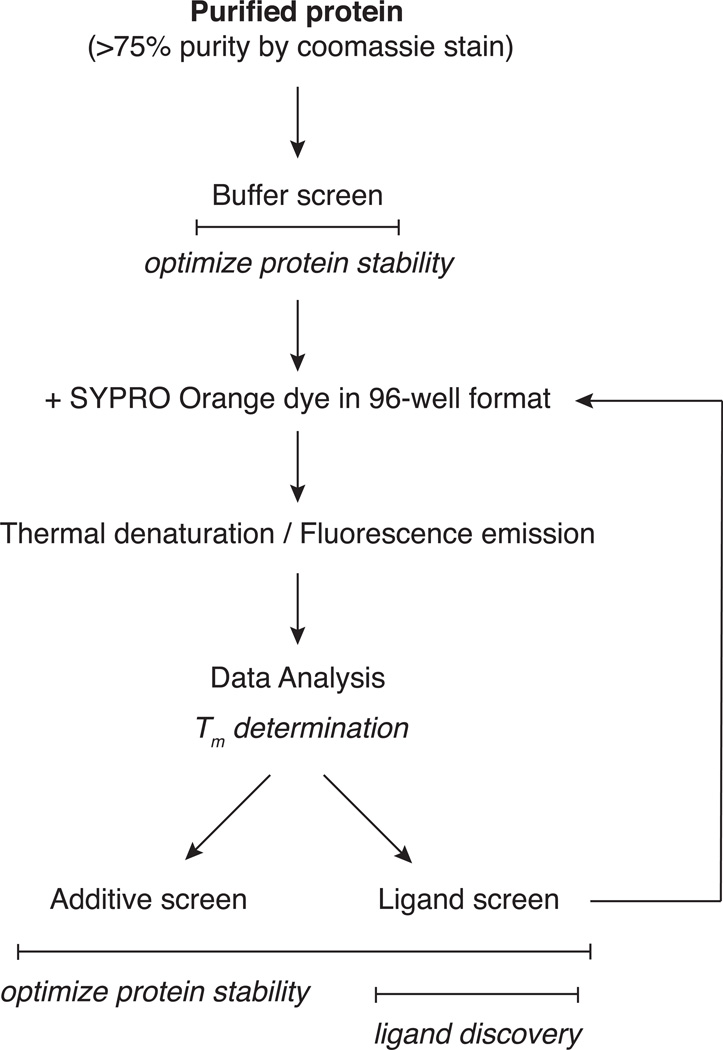
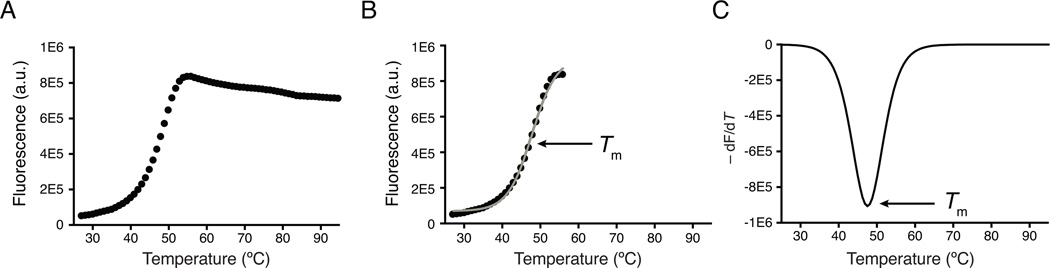
Purification of recombinant proteins for biochemical assays and structural studies is time-consuming and presents inherent difficulties that depend on the optimization of protein stability. The use of dyes to monitor thermal denaturation of proteins with sensitive fluorescence detection enables rapid and inexpensive determination of protein stability using real-time PCR instruments. By screening a wide range of solution conditions and additives in a 96-well format, the thermal shift assay easily identifies conditions that significantly enhance the stability of recombinant proteins. The same approach can be used as an initial low-cost screen to discover new protein-ligand interactions by capitalizing on increases in protein stability that typically occur upon ligand binding. This unit presents a methodological workflow for small-scale, high-throughput thermal denaturation of recombinant proteins in the presence of SYPRO Orange dye.

Keywords: TSA; ThermoFluor; buffer optimization; differential scanning fluorimetry; ligand screening; thermal denaturation.


Figures

Figure 1
Figure 1
Thermal shift analysis of protein stability and ligand interactions. (A) Starting with a purified recombinant protein in its native (folded) state, the protein is slowly heated to undergo thermal denaturation. The environmentally sensitive dye, SYPRO Orange, interacts with hydrophobic regions in the protein that become exposed upon denaturation. Binding low dielectric, hydrophobic regions increases fluorescence emission of the dye to serve as a read out of thermal denaturation of the protein. Represented on the left: ligand binding tends to rigidify proteins to increase their thermal stability. This general property allows identification of protein-binding ligands through increases in thermal stability. (B) Raw, truncated data from a typical 96-well screen of solution conditions. (C) An analysis of selected denaturation curves from part B shows that for a given pH (pH 7.0), the choice of buffer can impact overall protein stability. Here, the protein is significantly more stable in 50 mM sodium phosphate buffer, pH 7.0 than several others at the same concentration and pH, including: L-Arg/L-Glu, Tris, HEPES, and MOPS.
Figure 2
Figure 2
Flow chart of a thermal shift assay including an initial buffer optimization and subsequent additive or ligand screens. This figure connects all protocols presented in this unit.
Figure 3
Figure 3
Typical thermal shift assay data and analysis. (A) A typical thermal denaturation profile of a recombinant protein. Low fluorescence at room temperature indicates a well-folded protein. Fluorescence emission increases with increasing temperature, giving rise to a sigmoidal curve that represents cooperative unfolding of the protein. Post-peak aggregation of protein:dye complexes leads to quenching of the fluorescence signal. (B) Automated processing of thermal denaturation curves truncates the dataset to remove post-peak quenching. The resulting sigmoidal curves undergo non-linear fitting to a Boltzmann Equation to identify the melting temperature, or Tm, that occurs at the midpoint of the unfolding transition. The gray line represents the non-linear fit of the fluorescence curve to the Boltzmann Equation. (C) Alternatively, the Tm is easily identified by plotting the first derivative of the fluorescence emission as a function of temperature (−dF/dT). Here, the Tm is represented as the lowest part of the curve.

References

    1. Ablinger E, Leitgeb S, Zimmer A. Differential scanning fluorescence approach using a fluorescent molecular rotor to detect thermostability of proteins in surfactant-containing formulations. International journal of pharmaceutics. 2013;441(1–2):255–260. - PubMed
    1. Bruylants G, Wouters J, Michaux C. Differential scanning calorimetry in life science: thermodynamics, stability, molecular recognition and application in drug design. Current medicinal chemistry. 2005;12(17):2011–2020. - PubMed
    1. Crowther G, He P, Rodenbough P, Thomas A, Kovzun K, Leibly D, Bhandari J, Castaneda L, Hol W, Gelb M, Napuli A, Van Voorhis W. Use of thermal melt curves to assess the quality of enzyme preparations. Analytical biochemistry. 2010;399(2):268–275. - PMC - PubMed
    1. Dupeux F, Röwer M, Seroul G, Blot D, Márquez J. A thermal stability assay can help to estimate the crystallization likelihood of biological samples. Acta crystallographica. Section D, Biological crystallography. 2011;67(Pt 11):915–919. - PubMed
    1. Ericsson U, Hallberg B, Detitta G, Dekker N, Nordlund P. Thermofluor-based high-throughput stability optimization of proteins for structural studies. Analytical biochemistry. 2006;357(2):289–298. - PubMed

Publication types