. 2015 Apr;35(4):386-93.
doi: 10.1002/pd.4554. Epub 2015 Feb 4.

Modeling risk for severe adverse outcomes using angiogenic factor measurements in women with suspected preterm preeclampsia

Affiliations

Modeling risk for severe adverse outcomes using angiogenic factor measurements in women with suspected preterm preeclampsia

Glenn E Palomaki et al. Prenat Diagn. 2015 Apr.

Abstract

Introduction: Preeclampsia (PE) is a pregnancy-specific syndrome associated with adverse maternal and fetal outcomes. Patient-specific risks based on angiogenic factors might better categorize those who might have a severe adverse outcome.

Methods: Women evaluated for suspected PE at a tertiary hospital (2009-2012) had pregnancy outcomes categorized as 'referent' or 'severe', based solely on maternal/fetal findings. Outcomes that may have been influenced by a PE diagnosis were considered 'unclassified'. Soluble fms-like tyrosine kinase (sFlt1) and placental growth factor (PlGF) were subjected to bivariate discriminant modeling, allowing patient-specific risks to be assigned for severe outcomes.

Results: Three hundred twenty-eight singleton pregnancies presented at ≤34.0 weeks' gestation. sFlt1 and PlGF levels were adjusted for gestational age. Risks above 5 : 1 (10-fold over background) occurred in 77% of severe (95% CI 66 to 87%) and 0.7% of referent (95% CI <0.1 to 3.8%) outcomes. Positive likelihood ratios for the modeling and validation datasets were 19 (95% CI 6.2-58) and 15 (95% CI 5.8-40) fold, respectively.

Conclusions: This validated model assigns patient-specific risks of any severe outcome among women attending PE triage. In practice, women with high risks would receive close surveillance with the added potential for reducing unnecessary preterm deliveries among remaining women. © 2015 The Authors. Prenatal Diagnosis published by John Wiley & Sons Ltd.


Figures

Figure 1
Figure 1
Defining the study datasets and pregnancy outcomes. Women were excluded, if initial visit was after 34.0 weeks' gestation, records indicated multiple gestations, data were from a subsequent enrollment, or records had important missing data. A total of 328 unique women attending the clinic and enrolling prior to 34 weeks of gestation were randomized into a modeling (163) or validation (165) dataset. The last line shows the numbers of women in the three outcome categories (referent, severe and unclassified), as defined in Methods. The model was designed to differentiate between pregnancies in the referent population and those having a severe adverse outcome
Figure 2
Figure 2
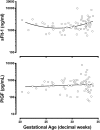
Gestational age-specific medians for SFlt1 and PlGF. These results are from the 69 referent women in the modeling dataset. The x-axis shows the gestational age at sample collection, up to 34.0 weeks of gestation. The logarithmic y-axes show sFlt1 and PlGF results. Solid lines/curves show the fitted regression equation indicating the reference (median) value by decimal gestational age (dGA). These equations are the following: median_sFlt1 = 10((0.0067947653*dGA∧2) + (−0.37004674*dGA) + 8.138) and median_PlGF = 10((0.011431524*dGA) + 2.374)
Figure 3
Figure 3
Bivariate comparison of angiogenic factor measurements in women with pregnancy outcomes classified as referent (69) or severe (36) from the modeling dataset. These figures show the relationships between two angiogenic factors (sFlt1 and PlGF) expressed as multiples of the median (MoM) that were selected for model development and the sFlt1/PlGF ratio. Values in pregnancies with severe outcomes are shown as small filled circles, while corresponding values in the referent pregnancies are shown as large open circles; for Figures 3A through 3C, the r-squared values in the referent and severe outcome groups are 0.02903, 0.4513; 0.3048, 0.2780; and 0.5649, 0.7341
Figure 4
Figure 4
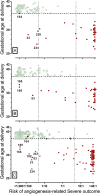
Patient-specific risk of an angiogenesis-related severe outcome versus gestational age at delivery. This figure shows the patient-specific risks assigned by the sFlt1 and PlGF model, applied to data from the referent and severe outcome groups. The model's risk of a severe outcome (logarithmic x-axis) is centered on the population baseline risk (1 : 2), with vertical dotted lines at 10-fold increases (right side) and 10-fold reductions (left side) in risk. From left to right, these three groups are considered to be low, intermediate and high risk. The decimal gestational age at delivery (y-axis) has a horizontal dashed line at 37.0 weeks, the cutoff used to delineate premature and term delivery. Severe outcomes are shown as small filled circles, while the referent pregnancies are shown as large open circles. Figure 4A shows results from the modeling dataset, Figure 4B from the validation dataset and Figure 4C from the combined dataset/model. In Figure 4C, a white dash (–) indicates those that are ACOG negative for PE among those with severe outcomes (filled red circles). A black plus (+) indicates an ACOG positive for PE among those with referent outcomes (open green circles)
Figure 5
Figure 5
Comparison of the sFlt1/PlGF ratio with the patient-specific modeled risks based on sFlt1 and PlGF measurements expressed as multiples of the median (MoM). These data are from the entire cohort using the combined model. Risks are capped at 100-fold decrease (or increase) in the baseline risk (r2 = 0.93)

Similar articles

Cited by

References

    1. Organization WH. 2005. World Health Report. Make every mother and child count. Geneva.
    1. Friedman SA, Schiff E, Kao L, et al. Neonatal outcome after preterm delivery for preeclampsia. Am J Obstet Gynecol. 1995;172:1785–8. discussion 1788–1792. - PubMed
    1. Thangaratinam S, Gallos ID, Meah N, et al. How accurate are maternal symptoms in predicting impending complications in women with preeclampsia? A systematic review and meta-analysis. Acta Obstet Gynecol Scand. 2011;90:564–73. - PubMed
    1. Thangaratinam S, Ismail KM, Sharp S, et al. Accuracy of serum uric acid in predicting complications of pre-eclampsia: a systematic review. BJOG. 2006;113:369–78. - PubMed
    1. Thangaratinam S, Koopmans CM, Iyengar S, et al. Accuracy of liver function tests for predicting adverse maternal and fetal outcomes in women with preeclampsia: a systematic review. Acta Obstet Gynecol Scand. 2011;90:574–85. - PubMed

Publication types