Comparative Study
. 2015 May;36(5):1995-2013.
doi: 10.1002/hbm.22751. Epub 2015 Jan 30.

Convergence and divergence across construction methods for human brain white matter networks: an assessment based on individual differences

Affiliations
Comparative Study

Convergence and divergence across construction methods for human brain white matter networks: an assessment based on individual differences

Suyu Zhong et al. Hum Brain Mapp. 2015 May.

Abstract

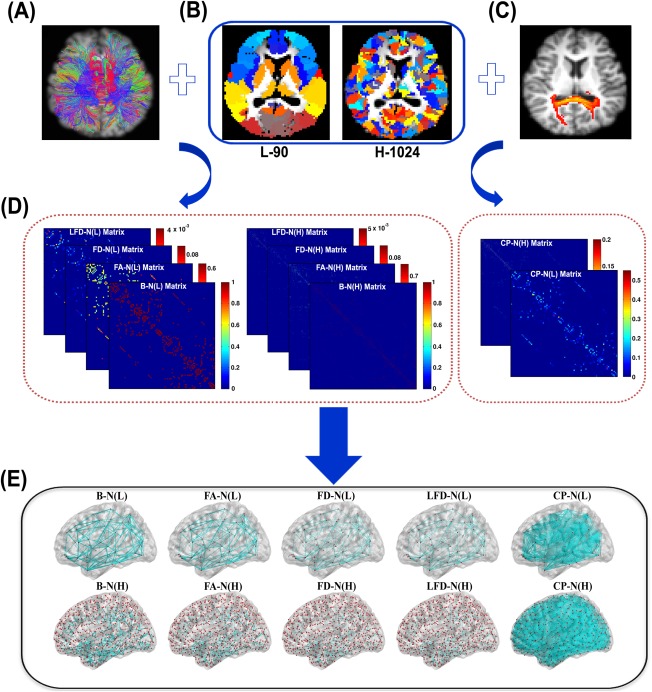
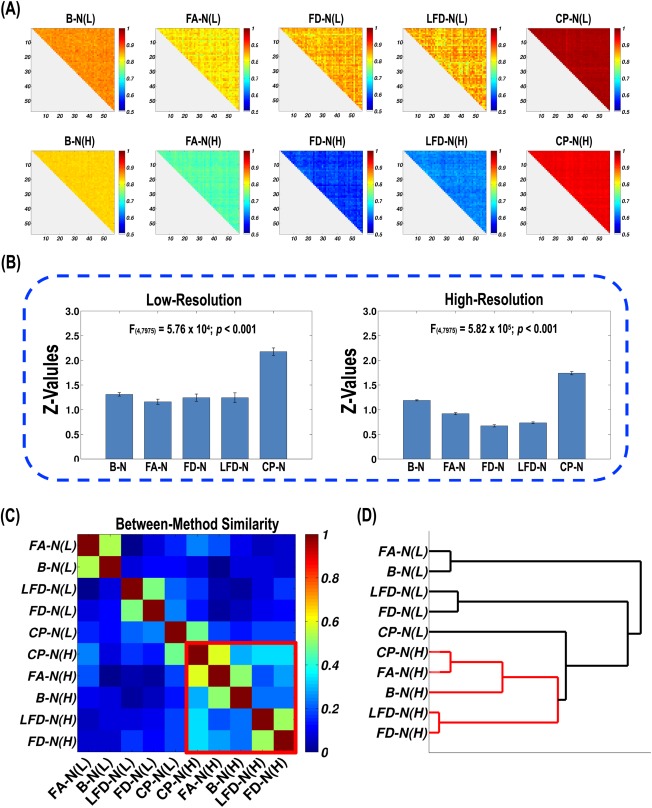
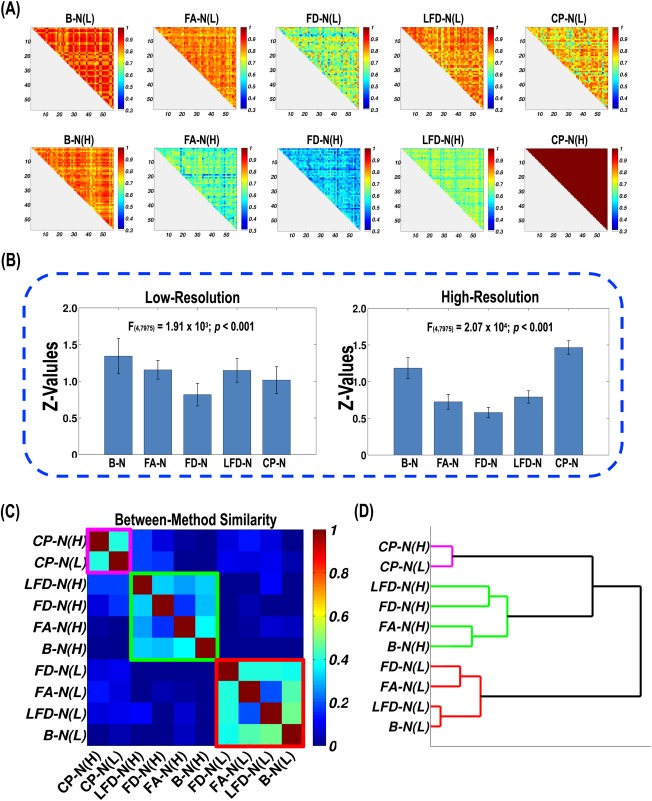
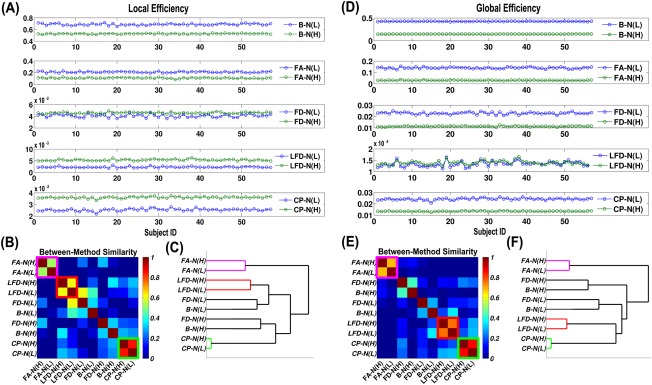
Using diffusion MRI, a number of studies have investigated the properties of whole-brain white matter (WM) networks with differing network construction methods (node/edge definition). However, how the construction methods affect individual differences of WM networks and, particularly, if distinct methods can provide convergent or divergent patterns of individual differences remain largely unknown. Here, we applied 10 frequently used methods to construct whole-brain WM networks in a healthy young adult population (57 subjects), which involves two node definitions (low-resolution and high-resolution) and five edge definitions (binary, FA weighted, fiber-density weighted, length-corrected fiber-density weighted, and connectivity-probability weighted). For these WM networks, individual differences were systematically analyzed in three network aspects: (1) a spatial pattern of WM connections, (2) a spatial pattern of nodal efficiency, and (3) network global and local efficiencies. Intriguingly, we found that some of the network construction methods converged in terms of individual difference patterns, but diverged with other methods. Furthermore, the convergence/divergence between methods differed among network properties that were adopted to assess individual differences. Particularly, high-resolution WM networks with differing edge definitions showed convergent individual differences in the spatial pattern of both WM connections and nodal efficiency. For the network global and local efficiencies, low-resolution and high-resolution WM networks for most edge definitions consistently exhibited a highly convergent pattern in individual differences. Finally, the test-retest analysis revealed a decent temporal reproducibility for the patterns of between-method convergence/divergence. Together, the results of the present study demonstrated a measure-dependent effect of network construction methods on the individual difference of WM network properties.

Keywords: connectome; diffusion MRI; graph theory; individual difference; inter-subject variability; test-retest.


Figures

Figure 1
Figure 1
The schematic construction for the 10 WM networks in this study. (A) The outputs from the deterministic tractography. (B) The two gray matter parcellation schemes: L‐90 and H‐1024. Each patch with a specific color represents a node in WM networks. (C) The outputs from the probabilistic tractography. Both deterministic and probabilistic tractography were applied to infer connections between every two nodes within WM networks. (D) The example network matrices for the 10 construction methods. Eight networks are based on the deterministic tractography, and the other two are from the probabilistic tractography. (E) The 3D rendering for the 10 WM networks. B‐N, binary network; FA‐N, FA weighted network; FD‐N, fiber‐density weighted network; LFD‐N, length‐corrected fiber‐density network; CP‐N, connectivity‐probability weighted network. (L) and (H) denote networks at low‐resolution and high‐resolution, respectively. [Color figure can be viewed in the online issue, which is available at http://wileyonlinelibrary.com.]
Figure 2
Figure 2
The schematic diagram for estimating subject‐to‐subject similarity in the spatial pattern of WM connections. (A) The WM networks of all subjects for a specific type of construction methods. The fiber‐density weighted networks at low‐resolution are displayed here as an example. (B) The WM connectivity matrix for all node pairs across all subjects. Each row and column represents a node pair and a subject, respectively. (C) The subject‐to‐subject matrix representing between‐subject similarity in the spatial pattern of WM connections. Each row and column represents a subject. The color represents Pearson correlation R‐values. (D) The scatter plot for the subject‐to‐subject Pearson correlation of connection weight. Here, the 40th and 50th subjects [marked out in (B) and (C)] were chosen as an example, and each circle represents a node pair. [Color figure can be viewed in the online issue, which is available at http://wileyonlinelibrary.com.]
Figure 3
Figure 3
The schematic diagram for estimating subject‐to‐subject similarity in the spatial pattern of nodal efficiency. (A) The distribution of nodal efficiency of all subjects for a specific type of construction methods. Furthermore, the fiber‐density weighted networks at low‐resolution are displayed here. (B) The nodal efficiency matrix for all nodes across all subjects. Each row and column represents a node and a subject, respectively. (C) The subject‐to‐subject matrix representing between‐subject similarity in the spatial pattern of nodal efficiency. Each row and column represents a subject. The color represents Pearson correlation R‐values. (D) The scatter plot for the subject‐to‐subject Pearson correlation of connection weight. Again, the 40th and 50th subjects [marked out in (B) and (C)] were chosen as an example and each circle represents a node. [Color figure can be viewed in the online issue, which is available at http://wileyonlinelibrary.com.]
Figure 4
Figure 4
The method effects on individual differences in the spatial pattern of WM connections. (A) The 10 subject‐to‐subject similarity matrices for WM network construction methods. (B) The statistics of subject‐to‐subject similarity values for each method. The Pearson correlation R‐values were first converted to Z‐scores. According to the repeated‐measure ANOVA, significant differences were found across WM networks at low‐resolution and high‐resolution. (C) The similarity matrix representing method‐to‐method convergence of individual differences in the spatial pattern of WM connections. Each row and column represents a network construction method. The row and column were reordered to better visualize the clusters, which are marked by diagonal rectangles in red. (D) The hierarchical clustering dendrogram for construction methods. The lines are colored in terms of the clusters in (C). [Color figure can be viewed in the online issue, which is available at http://wileyonlinelibrary.com.]
Figure 5
Figure 5
The method effects on individual differences in the spatial pattern of nodal efficiency. (A) The 10 subject‐to‐subject similarity matrices for WM network construction methods. (B) The statistics of subject‐to‐subject similarity values for each method. The Pearson correlation R‐values were first converted to Z‐scores. Significant differences were observed across WM networks at low‐resolution and high‐resolution. (C) The similarity matrix representing method‐to‐method convergence of individual differences in the spatial pattern of nodal efficiency. Each row and column represents a network construction method. The clusters are marked by diagonal rectangles in purple, red, and green. (D) The hierarchical clustering dendrogram for methods. The lines are colored in terms of the clusters in (C). [Color figure can be viewed in the online issue, which is available at http://wileyonlinelibrary.com.]
Figure 6
Figure 6
The method effects on individual differences in network global efficiency and local efficiency. (A) The subject course of local efficiency for the 10 WM networks. (B) The similarity matrix representing method‐to‐method convergence of individual differences in local efficiency. The obvious clusters are marked by diagonal rectangles in purple, red, and green. (C) The hierarchical clustering dendrogram for methods in terms of local efficiency. The lines are colored in purple, red, and green to match the clusters. (D) The subject course of global efficiency for the 10 WM networks. (E) The similarity matrix representing method‐to‐method convergence of individual differences in global efficiency. (F) The hierarchical clustering dendrogram for methods in terms of global efficiency. [Color figure can be viewed in the online issue, which is available at http://wileyonlinelibrary.com.]
Figure 7
Figure 7
The test–retest reproducibility for subject‐to‐subject similarity values. (A) The results of two sessions for the spatial pattern of WM connections. (B) The results for the spatial pattern of nodal efficiency. In the scatter plots, the horizontal and vertical axes represent the first and second session, respectively. Each circle denotes a subject pair. [Color figure can be viewed in the online issue, which is available at http://wileyonlinelibrary.com.]
Figure 8
Figure 8
The test–retest reproducibility for method‐to‐method similarity values and hierarchical clustering. (A) The method‐to‐method similarity matrices of two sessions for all network properties. For the scatter plots, the horizontal and vertical axes represent the first and second session, respectively. Each circle denotes a method pair. (B) The method dendrogram of two sessions for all network properties. The same network property was arranged in the same row for (A) and (B). [Color figure can be viewed in the online issue, which is available at http://wileyonlinelibrary.com.]

Similar articles

Cited by

References

    1. Achard S, Bullmore E (2007): Efficiency and cost of economical brain functional networks. PLoS Comput Biol 3:e17. - PMC - PubMed
    1. Bai F, Shu N, Yuan Y, Shi Y, Yu H, Wu D, Wang J, Xia M, He Y, Zhang Z (2012): Topologically convergent and divergent structural connectivity patterns between patients with remitted geriatric depression and amnestic mild cognitive impairment. J Neurosci 32:4307–4318. - PMC - PubMed
    1. Bassett DS, Brown JA, Deshpande V, Carlson JM, Grafton ST (2011): Conserved and variable architecture of human white matter connectivity. Neuroimage 54:1262–1279. - PubMed
    1. Bastiani M, Shah NJ, Goebel R, Roebroeck A (2012): Human cortical connectome reconstruction from diffusion weighted MRI: The effect of tractography algorithm. Neuroimage 62:1732–1749. - PubMed
    1. Batalle D, Eixarch E, Figueras F, Munoz‐Moreno E, Bargallo N, Illa M, Acosta‐Rojas R, Amat‐Roldan I, Gratacos E (2012): Altered small‐world topology of structural brain networks in infants with intrauterine growth restriction and its association with later neurodevelopmental outcome. Neuroimage 60:1352–1366. - PubMed

Publication types

LinkOut - more resources