. 2015 Feb 2:5:8163.
doi: 10.1038/srep08163.

Cigarette smoke alters primary human bronchial epithelial cell differentiation at the air-liquid interface

Affiliations

Cigarette smoke alters primary human bronchial epithelial cell differentiation at the air-liquid interface

Andrea C Schamberger et al. Sci Rep. .

Abstract

The differentiated human airway epithelium consists of different cell types forming a polarized and pseudostratified epithelium. This is dramatically altered in chronic obstructive pulmonary disease (COPD), characterized by basal and goblet cell hyperplasia, and squamous cell metaplasia. The effect of cigarette smoke on human bronchial epithelial cell (HBEC) differentiation remains to be elucidated. We analysed whether cigarette smoke extract (CSE) affected primary (p)HBEC differentiation and function. pHBEC were differentiated at the air-liquid interface (ALI) and differentiation was quantified after 7, 14, 21, or 28 days by assessing acetylated tubulin, CC10, or MUC5AC for ciliated, Clara, or goblet cells, respectively. Exposure of differentiating pHBEC to CSE impaired epithelial barrier formation, as assessed by resistance measurements (TEER). Importantly, CSE exposure significantly reduced the number of ciliated cells, while it increased the number of Clara and goblet cells. CSE-dependent cell number changes were reflected by a reduction of acetylated tubulin levels, an increased expression of the basal cell marker KRT14, and increased secretion of CC10, but not by changes in transcript levels of CC10, MUC5AC, or FOXJ1. Our data demonstrate that cigarette smoke specifically alters the cellular composition of the airway epithelium by affecting basal cell differentiation in a post-transcriptional manner.


Figures
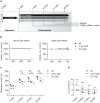
Figure 1
Figure 1. Non-toxic doses of CSE impair epithelial barrier establishment during pHBEC differentiation.
(a) Schematic overview of pHBEC differentiation in the presence of CSE: pHBECs were seeded at transwell inserts and expanded for 48 hours until confluency. Cells were subsequently air-lifted and basolateral media was exchanged to differentiation medium with or without CSE. The medium was renewed every 2–3 days and samples were taken for analysis after 7, 14, 21, or 28 days of differentiation. (b) Analysis of LDH assay of air-lifted pHBECs exposed to 0% (NT), 2.5%, or 5% CSE for up to 72 hours. LDH was determined in the cell culture supernatant (left panel) as well as in the basolateral medium (right panel) from three independent experiments. Data were normalized to time-matched negative controls (non-treated cells) and positive controls (maximal LDH activity measured in non-treated lysed cells). (c) TEER development over 28 days of pHBEC differentiation in the absence or presence of CSE (2.5% or 5% CSE). Data of 3 independently performed differentiations with mean are shown. *p < 0.05, **p < 0.01, ***p < 0.001 (two-way ANOVA). (d) qRT-PCR analysis of CYP1A1 transcript levels of pHBECs differentiated up to 28 days in the absence or presence of CSE (2.5% or 5% CSE). Data are depicted as mean ± SD from 3 independent differentiations. Relative transcript abundance of a gene is expressed as ΔΔCt = [ΔCt(gene of interest, condition NT, day 7)] – [ΔCt(gene of interest, condition X, day X)] with ΔCt = Ct(gene of interest) – Ct (reference); increase = increase in gene expression. For non-treated cells at day 21 or day 28, when transcripts levels were below detection level, Ct = 40 was used for statistical analysis. For 5% CSE vs. NT: **p < 0.01, ***p < 0.001. For 2.5% CSE vs. NT: §p < 0.05, $p < 0.001 (two-way ANOVA).
Figure 2
Figure 2. CSE specifically reduces the number of ciliated cells in differentiating pHBECs.
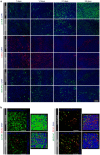
Indirect immunofluorescence analysis of non-treated or chronically treated (5% CSE) pHBECs. (a) pHBECs differentiated for 7, 14, 21, or 28 days at ALI. Representative acTUB (acetylated tubulin), CC10 (Clara cell-specific protein), and MUC5AC (mucin 5AC) is shown in green or red, as depicted, and DAPI staining in blue. Scale bar: 100 μm. (b) Representative z-stacks (left subpanel) with corresponding shadow projection (right subpanel) are shown for 28 days differentiated pHBECs. acTUB, MUC5AC, or CC10 is shown in green or red, as depicted, and DAPI staining in blue. Scale bar: 50 μm.
Figure 3
Figure 3. CSE shifts cell populations in differentiating pHBECs.
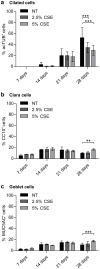
Quantification of ciliated cells (a), Clara cells (b), or goblet cells (c) in the course of pHBEC differentiation in the absence or presence of CSE (2.5% or 5% CSE). Cell types were determined by positivity for the following markers: acTUB for ciliated cells (a), CC10 for Clara cells (b), and MUC5AC for goblet cells (c). Data are depicted as mean ± SD from 3 independent differentiations. 12 images per group were analysed. **p < 0.01, ***p < 0.001 (two-way ANOVA).
Figure 4
Figure 4. Chronic CSE exposure of pHBECs does not affect differentiation markers on mRNA level.
qRT-PCR analysis of transcript levels of the ciliated cell marker FOXJ1 (a), the Clara cell marker CC10 (b), the goblet cell markers MUC5AC and MUC5B (c), squamous cell marker IVL (d) and the basal cell markers KRT5, KRT14, and TP63 (e). pHBECs were differentiated up to 28 days in the absence or presence of CSE (2.5% or 5% CSE). Data are depicted as mean ± SD from 3 independent differentiations. Relative transcript abundance of a gene is expressed as ΔΔCt = [ΔCt(gene of interest, condition NT, day 7)] – [ΔCt(gene of interest, condition X, day X)] with ΔCt = Ct(gene of interest) – Ct (reference); increase = increase in gene expression. For 5% CSE vs. NT: **p < 0.01, ***p < 0.001. For 2.5% CSE vs. NT: §p < 0.05 (two-way ANOVA).
Figure 5
Figure 5. CSE does not alter transcript levels of FOXJ1 target genes.
qRT-PCR analysis of transcript levels of the FOXJ1 target genes DNAI1, DNALI1, SPAG6, and TEKT1. pHBECs were differentiated up to 28 days in the absence or presence of CSE (2.5% or 5% CSE). Data are depicted as mean ± SD from 3 independent differentiations. Relative transcript abundance of a gene is expressed as ΔΔCt = [ΔCt(gene of interest, condition NT, day 7)] – [ΔCt(gene of interest, condition X, day X)] with ΔCt = Ct(gene of interest) – Ct (reference); increase = increase in gene expression.
Figure 6
Figure 6. CSE alters protein expression of differentiation markers in pHBECs.
(a) Western blot analysis of protein extracts from 7, 14, 21, or 28 days differentiated pHBECs either non-treated (NT) or treated for up to 28 days with CSE (2.5% or 5% CSE). Representative blots of acTUB (ciliated cell marker), CC10 (Clara cell marker), KRT5 and KRT14 (basal cell markers) and GAPDH as a loading control are shown. Protein samples were run on 8% and 15% gels under the same experimental conditions. Blots were cropped to improve clarity, full-length blots are presented in Supplementary Figure S2a. (b) Protein levels of KRT5 and KRT14 were quantified via densitometry analysis using Image Lab software. Data are depicted as mean ± SEM of four independent differentiations relative to GAPDH. Upper panel: In controls, KRT5 and KRT14 levels significantly decreased over time. **p < 0.01 vs. 7 days (one-way ANOVA). Middle and lower panel: KRT5 and KRT14 levels after CSE treatment at different time points. *p < 0.05, **p < 0.01 vs. NT at 28 days (two-way ANOVA). (c) Representative Western blot analysis for secreted CC10 in cell supernatants from 7, 14, 21, or 28 days differentiated pHBECs either non-treated (NT) or treated for up to 28 days with CSE (2.5% or 5% CSE) is shown. The blot was cropped to improve clarity, a full-length blot is presented in Supplementary Figure S2b.

Similar articles

Cited by

References

    1. Staudt M. R. et al. Smoking Is Associated With A Loss Of Ciliated Cells Throughout The Airways. Am J Resp Crit Care Med - Meeting Abstracts 2014 189, A4097–A4097, 10.1164/ajrccm-conference.2014.189.1_MeetingAbstracts.A4097 (2014). - DOI
    1. Boers J. E., Ambergen A. W. & Thunnissen F. B. Number and proliferation of clara cells in normal human airway epithelium. Am J Resp Crit Care Med 159, 1585–1591, 10.1164/ajrccm.159.5.9806044 (1999). - DOI - PubMed
    1. Rogers D. F. The airway goblet cell. Int J Biochem Cell 35, 1–6, 10.1016/S1357-2725(02)00083-3 (2003). - DOI - PubMed
    1. Boers J. E., Ambergen A. W. & Thunnissen F. B. Number and proliferation of basal and parabasal cells in normal human airway epithelium. Am J Resp Crit Care Med 157, 2000–2006, 10.1164/ajrccm.157.6.9707011 (1998). - DOI - PubMed
    1. Tam A., Wadsworth S., Dorscheid D., Man S. F. & Sin D. D. The airway epithelium: more than just a structural barrier. Ther Adv Respir Dis 5, 255–273, 10.1177/1753465810396539 (2011). - DOI - PubMed

Publication types