. 2015 Feb 2:6:6022.
doi: 10.1038/ncomms7022.

Sorting of small infectious virus particles by flow virometry reveals distinct infectivity profiles

Affiliations

Sorting of small infectious virus particles by flow virometry reveals distinct infectivity profiles

Raphaël Gaudin et al. Nat Commun. .

Abstract

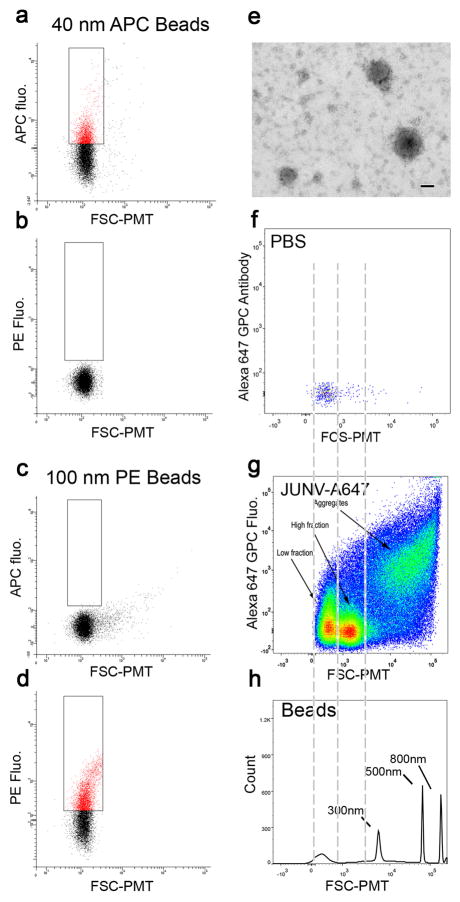
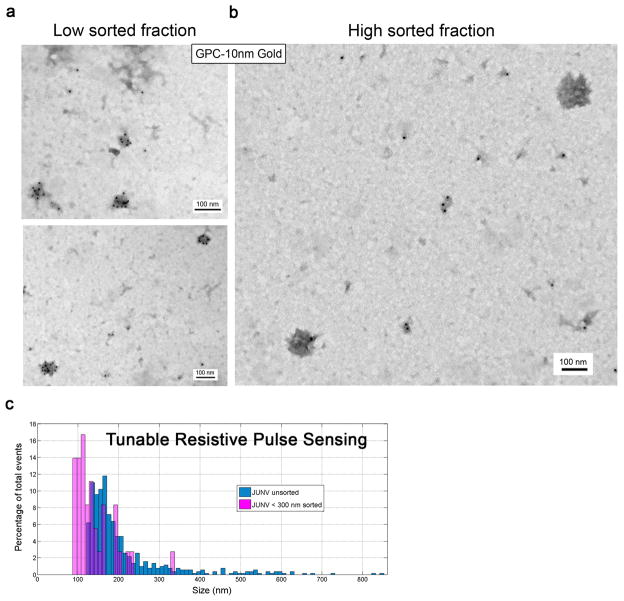
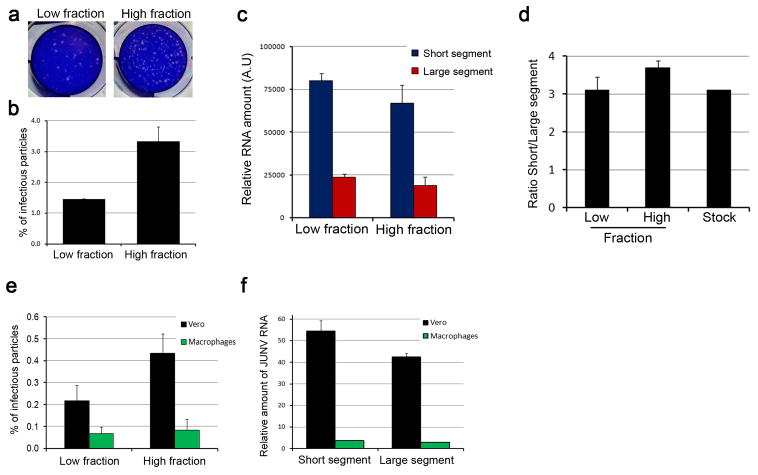
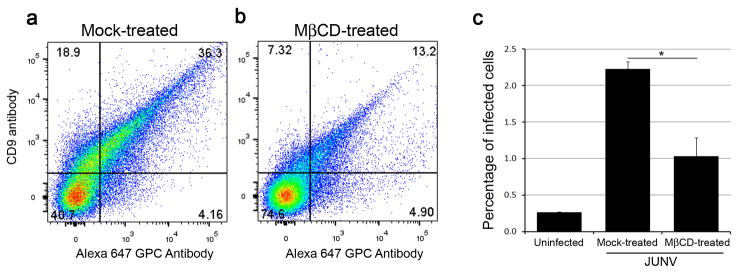
The nature and concentration of lipids and proteins at the surface of viruses are essential parameters for determining particle infectiveness. Historically, averaged bulk analysis of viral particles has been the primary method to quantitatively investigate these parameters, though this neglects heterogeneity within populations. Here we analyse the properties of Junin virus particles using a sensitive flow virometry assay and further sort virions while conserving their infectiveness. This method allows us to characterize the relationship between infectivity, virus size and RNA content and to compare particles secreted by Vero cells with those from physiologically relevant human primary macrophages. Our study highlights significant differences in particle infectivity according to its nature, the type of producer cells and the lipid membrane composition at the budding site. Together, our results present the flow virometry assay as a powerful and versatile tool to define virus particle profiles.


Conflict of interest statement

Competing financial interests

The authors declare no conflict of interest.

Figures

Figure 1
Figure 1
Flow cytometry analysis of small particles. (a–d) 40 nm APC-conjugated latex beads (a,b) and 100 nm PE-conjugated latex beads (c,d) were analyzed on our custom-made flow cytometer and plotted for APC fluorescence (a,c) or PE fluorescence (b,d) as a function of the FSC-PMT parameter. The 40 nm and 100 nm beads were specifically detected from their respective fluorophores. (e) Junin viruses concentrated by ultracentrifugation were adsorbed on carbon-coated TEM grids and labeled with the GPC specific LD05 mouse monoclonal antibody followed by a secondary anti-mouse antibody and revealed by Protein A 10 nm gold beads. Contrast was obtained by negative staining. Bar = 50 nm. JUNV particles of various sizes were all positive for the GPC antibody staining. (f,g) Flow virometry analysis of PBS (f) or purified viral particles stained with a GPC antibody coupled to an Alexa Fluor 647 (JUNV-A647; g). The plot shows Alexa 647 GPC fluorescence versus FSC-PMT. Both samples were run using the same parameters, at the same speed and for the same amount of time. (g) Several populations could be distinguished and are pointed out by labeled arrows. Fluorescence-based thresholding was used to decrease noise events. (h) Non-fluorescent polystyrene beads of larger size (300, 500 and 800 nm) were detected by FSC-PMT channel only. The area between the two first gray dashed lines shows FSC-PMT events that are at the level of the background. The area between the second and third dashed lines correspond to events above background but smaller than 300 nm.
Figure 2
Figure 2
Sorting of infectious viruses by flow virometry. (a,b) JUNV-A647 particles were sorted directly onto carbon-coated TEM grids and labeled with the GPC specific GD01 antibody followed by a secondary antibody, then revealed by Protein A 10 nm gold beads. The low (a) and high (b) fractions were negatively staining and analyzed by transmission electron microscopy. Several particles per micrograph are shown and the images are representative of each population. The low fraction viruses are about 60 nm in diameter, while the high fraction viruses are around 150 nm. (c) Tunable Resistive Pulse Sensing (TRPS) was performed on unsorted (blue bars) or sorted particles smaller than 300 nm (pink bars). The histograms show the distribution of particle size detected in each sample.
Figure 3
Figure 3
Infectious properties of sorted particles from the low and high fractions. (a,b) Confluent Vero cells were infected with 3,000 sorted particles in 300 μl virus media for 1h, subsequently overlaid with Virus media containing 1% melted agarose and incubated for 5 days. Plaques forming units were revealed by crystal violet staining. (a) Images correspond to plaques observed in representative wells infected with 3,000 particles from the low (left) and high (right) fractions. (b) Quantification of the percentage of infectious particles from the low and high fractions. Error bars are mean +/− s.d. of duplicates and the histogram is representative of four independent experiments. (c) Relative amount of RNA contained in 20,000 sorted particles for each fraction. Reverse transcriptase RT-qPCR with primers targeting the Short (blue) or the Large (red) segment of JUNV is shown. Low and high fractions showed similar RNA levels for both Short and Large segments. Error bars are the mean +/− s.d. of triplicates and the data is representative of 2 independent experiments. (d) Ratio of the relative amount of Short to Large segment in the low and high fractions and in the virus stock. RNA ratio remains constant in all three samples. (e) Quantification of the percentage of infectious particles produced by Vero cells (black bars) or human primary macrophages (green bars) from the low and high fractions. (f) Relative amount of RNA contained in 15,000 sorted particles from Vero cells (black bars) or human primary macrophages (green bars). Reverse transcriptase RT-qPCR with primers targeting the Short or the Large segment of JUNV is shown. Error bars are the mean +/− s.d. of triplicates.
Figure 4
Figure 4
Correlation between Glycoprotein (GPC) levels and RNA content. Flow virometry assay of JUNV particles stained with Alexa 647 GPC antibody only (a) or YOYO-1 only (b). Dot plots represent nucleic acid dye fluorescence (x axis) as a function of the Alexa 647 GPC fluorescence (y axis). (c) Flow virometry analysis of particles stained with both Alexa 647 GPC antibody and the nucleic acid dye YOYO-1. (d) Pie charts representing the percentage of potentially infectious particles (GPC+ RNA+) in the low and high fractions. The high fraction contains about 2.5 times more virions with both genetic material and surface GPC than the low fraction. (e, f) Relative amount of RNA contained in 20,000 sorted particles from total RNA+ or GPC+ RNA+ viral particles. Reverse transcriptase RT-qPCR with primers targeting the Short (e) or the Large (f) segment of JUNV is shown. Error bars are the mean +/− s.d. of triplicates.
Figure 5
Figure 5
Junin virus buds at CD9-enriched sites. JUNV-A647 viral particles stained with either a CD9 antibody conjugated to PE (a) or Cholera Toxin B (CTB) conjugated to FITC (b) were analyzed by flow virometry and plotted as a function of Alexa 647 GPC antibody staining. (c) JUNV particles stained with a GPC antibody coupled to an Alexa Fluor 647 as in Figure 1g, were adsorbed on glow discharged glass coverslip. Samples were blocked in 0.5% BSA in PBS for 30 min, incubated with mouse anti-CD9 antibody coupled to PE for 30 min and then washed extensively in 0.5% BSA in PBS. Coverslips were mounted on slides and image by spinning disk confocal microscopy. The micrograph represents CD9-PE (red) and JUNV-A647 (cyan) and the red channel was shifted by 6 pixels up in order to better appreciate colocalization of the two fluorophores. Over 500 JUNV-A647 particles were counted and Pearson correlation with CD9-PE was evaluated at 0.77 +/− 0.1. Bar = 5 μm. (d) Vero cells infected with JUNV for 24 hrs were fixed, permeabilized and stained with a CD9 antibody conjugated to PE and the GPC specific GD01 antibody conjugated to Alexa Fluor 488. Images were acquired by spinning disk confocal microscopy and represent the plasma membrane of an infected cell. The images show CD9 staining (upper panel), GPC staining (middle panel) and the overlay of the two channels (bottom panel). The pink arrows highlight GPC positive spots, likely corresponding to budding events that are enriched in CD9. Bar = 5 μm.
Figure 6
Figure 6
Cholesterol depletion of producer cells decreases infectivity of budding viruses. Vero cells infected for 24 hrs with JUNV were mock-treated (a) or treated with 10 mM Methyl-β-Cyclodextrin (MβCD-treated; b) for 1 hr at 37°C. Cells were then extensively washed with PBS and incubated for an additional 12 hrs at 37°C. Subsequently, supernatant was harvested and stained with LD05 GPC antibody conjugated to Alexa Fluor 647 and CD9 antibody conjugated to PE as in Figure 5a. Dot plots show CD9 antibody fluorescence as a function of Alexa 647 GPC antibody staining. Percentages in each corner indicate the proportion of each population in the given quadrant. The data shows that MβCD treatment strongly decreases CD9 at the surface of virions. (c) JUNV-A647 particles from MβCD or mock treated producer cells were sorted and 8,000 particles per conditions were used to infect Vero cells for 16 hrs. Subsequently, Vero cells were stained with a viral Nucleoprotein specific antibody conjugated to an Alexa Fluor 647 and analyzed by flow cytometry to measure the percentage of infected cells. A two-fold decrease in infectivity was observed when producer cells were treated with MβCD compared to the mock condition. Error bars are the mean +/− s.d. of duplicates where at least 10,000 cells per sample were acquired. The difference marked by the star is significant (unpaired t-test p value = 0.024).

References

    1. Marie D, Brussaard CPD, Thyrhaug R, Bratbak G, Vaulot D. Enumeration of marine viruses in culture and natural samples by flow cytometry. Applied and environmental microbiology. 1999;65:45–52. - PMC - PubMed
    1. Nolte-’t Hoen EN, et al. Quantitative and qualitative flow cytometric analysis of nanosized cell-derived membrane vesicles. Nanomedicine: nanotechnology, biology, and medicine. 2012;8:712–720. doi: 10.1016/j.nano.2011.09.006. - DOI - PMC - PubMed
    1. van der Vlist EJ, Nolte-’t Hoen EN, Stoorvogel W, Arkesteijn GJ, Wauben MH. Fluorescent labeling of nano-sized vesicles released by cells and subsequent quantitative and qualitative analysis by high-resolution flow cytometry. Nature protocols. 2012;7:1311–1326. doi: 10.1038/nprot.2012.065. - DOI - PubMed
    1. Nolte-’t Hoen EN, et al. Dynamics of dendritic cell-derived vesicles: high-resolution flow cytometric analysis of extracellular vesicle quantity and quality. Journal of leukocyte biology. 2013;93:395–402. doi: 10.1189/jlb.0911480. - DOI - PubMed
    1. Steen HB. Flow cytometer for measurement of the light scattering of viral and other submicroscopic particles. Cytometry. Part A: the journal of the International Society for Analytical Cytology. 2004;57:94–99. doi: 10.1002/cyto.a.10115. - DOI - PubMed

Publication types