

Bisphosphonate treatment of type I diabetic mice prevents early bone loss but accentuates suppression of bone formation
- PMID: 25641511
- PMCID: PMC4724196
- DOI: 10.1002/jcp.24929
Bisphosphonate treatment of type I diabetic mice prevents early bone loss but accentuates suppression of bone formation
Abstract
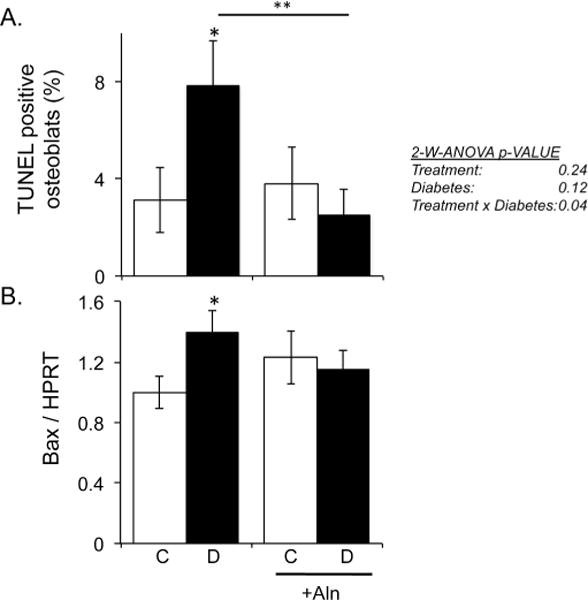
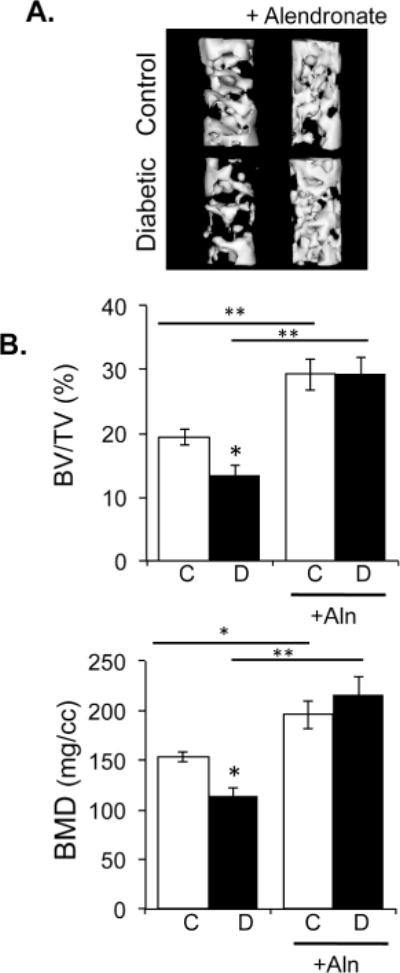
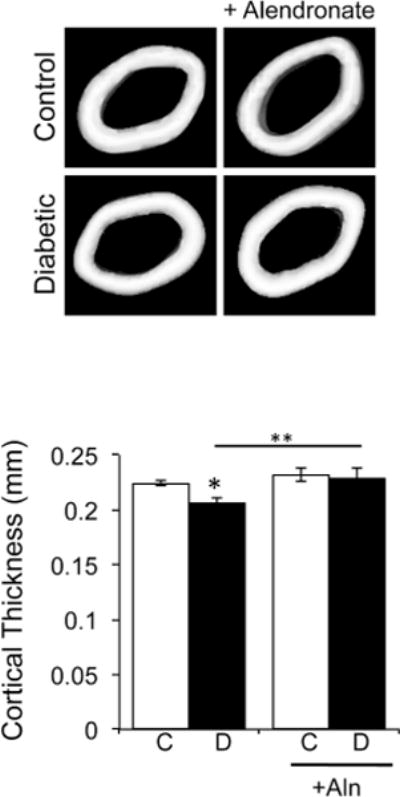
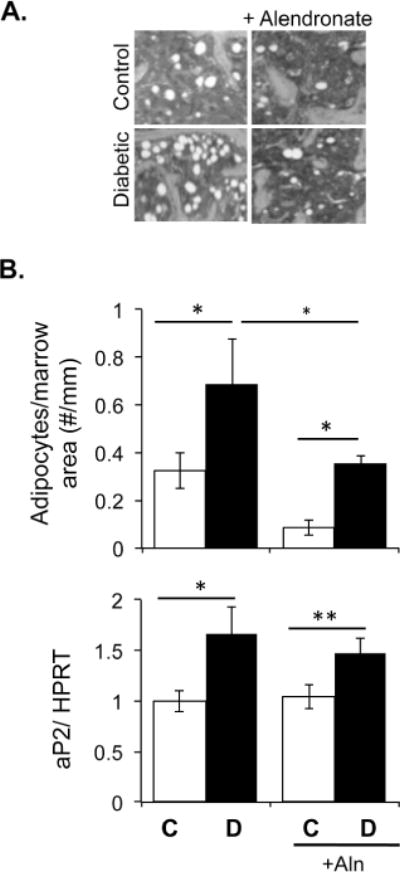
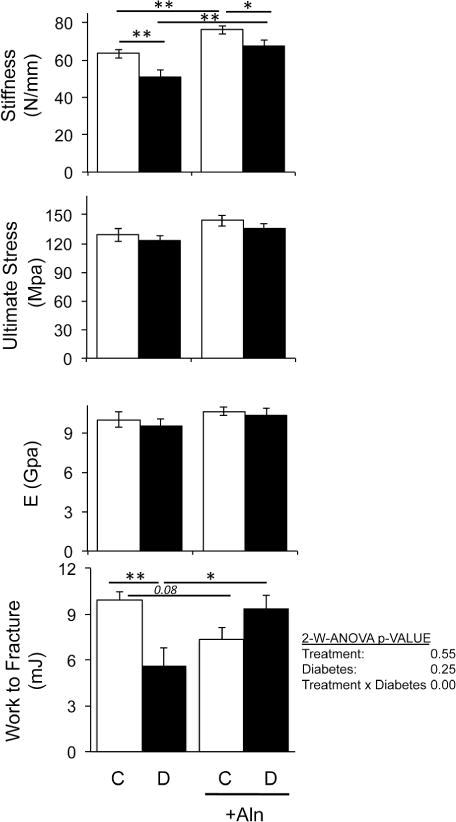
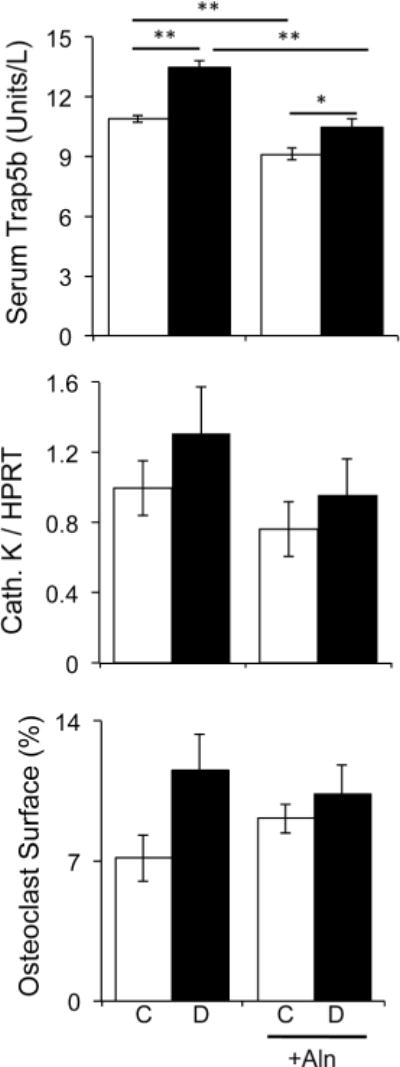
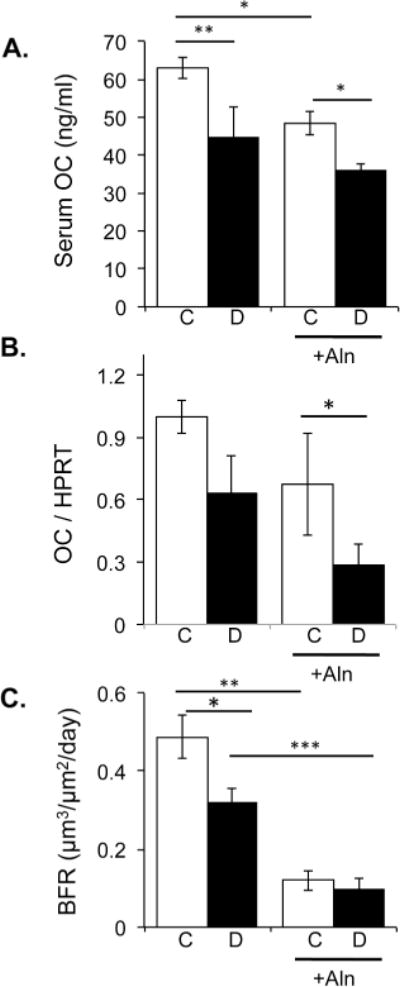
Type I (T1) diabetes is an autoimmune and metabolic disease associated with bone loss. Previous studies demonstrate that T1-diabetes decreases osteoblast activity and viability. Bisphosphonate therapy, commonly used to treat osteoporosis, is demonstrated to inhibit osteoclast activity as well as osteoblast apoptosis. Therefore, we examined the effect of weekly alendronate treatments on T1-diabetes induced osteoblast apoptosis and bone loss. Bone TUNEL assays identified that alendronate therapy prevents the diabetes-induced osteoblast death observed during early stages of diabetes development. Consistent with this, alendronate treatment for 40 days was able to prevent diabetes-induced trabecular bone loss. Alendronate was also able to reduce marrow adiposity in both control diabetic mice compared to untreated mice. Mechanical testing indicated that 40 days of alendronate treatment increased bone stiffness but decreased the work required for fracture in T1-diabetic and alendronate treated mice. Of concern at this later time point, bone formation rate and osteoblast markers, which were already decreased in diabetic mice, were further suppressed in alendronate-treated diabetic mice. Taken together, our results suggest that short-term alendronate treatment can prevent T1-diabetes-induced bone loss in mice, possibly in part by inhibiting diabetes onset associated osteoblast death, while longer treatment enhanced bone density but at the cost of further suppressing bone formation in diabetic mice.
© 2015 Wiley Periodicals, Inc.
Figures
Similar articles
-
Caspase-2 deficiency protects mice from diabetes-induced marrow adiposity.J Cell Biochem. 2011 Sep;112(9):2403-11. doi: 10.1002/jcb.23163. J Cell Biochem. 2011. PMID: 21538476
-
CCAAT/enhancer binding protein β-deficiency enhances type 1 diabetic bone phenotype by increasing marrow adiposity and bone resorption.Am J Physiol Regul Integr Comp Physiol. 2011 May;300(5):R1250-60. doi: 10.1152/ajpregu.00764.2010. Epub 2011 Feb 23. Am J Physiol Regul Integr Comp Physiol. 2011. PMID: 21346244 Free PMC article.
-
Aminobisphosphonates cause osteoblast apoptosis and inhibit bone nodule formation in vitro.Calcif Tissue Int. 2008 Mar;82(3):191-201. doi: 10.1007/s00223-008-9104-y. Epub 2008 Feb 8. Calcif Tissue Int. 2008. PMID: 18259679
-
Bisphosphonates for prevention of postmenopausal osteoporosis.Dan Med Bull. 2002 Feb;49(1):1-18. Dan Med Bull. 2002. PMID: 11894721 Review.
-
Diabetes and Its Effect on Bone and Fracture Healing.Curr Osteoporos Rep. 2015 Oct;13(5):327-35. doi: 10.1007/s11914-015-0286-8. Curr Osteoporos Rep. 2015. PMID: 26254939 Free PMC article. Review.
Cited by
-
Alendronate improves fasting plasma glucose and insulin sensitivity, and decreases insulin resistance in prediabetic osteopenic postmenopausal women: A randomized triple-blind clinical trial.J Diabetes Investig. 2019 May;10(3):731-737. doi: 10.1111/jdi.12944. Epub 2018 Oct 23. J Diabetes Investig. 2019. PMID: 30267620 Free PMC article. Clinical Trial.
-
Effects of ultraviolet irradiation with a LED device on bone metabolism associated with vitamin D deficiency in senescence-accelerated mouse P6.Heliyon. 2020 Feb 28;6(2):e03499. doi: 10.1016/j.heliyon.2020.e03499. eCollection 2020 Feb. Heliyon. 2020. PMID: 32140604 Free PMC article.
-
Exercise prevents high fat diet-induced bone loss, marrow adiposity and dysbiosis in male mice.Bone. 2019 Jan;118:20-31. doi: 10.1016/j.bone.2018.03.024. Epub 2018 Mar 29. Bone. 2019. PMID: 29604350 Free PMC article.
-
Diabetes and bone health: latest evidence and clinical implications.Ther Adv Musculoskelet Dis. 2017 Mar;9(3):67-74. doi: 10.1177/1759720X16687480. Epub 2017 Jan 24. Ther Adv Musculoskelet Dis. 2017. PMID: 28344668 Free PMC article. Review.
-
Effects and Mechanism of Zishen Jiangtang Pill on Diabetic Osteoporosis Rats Based on Proteomic Analysis.Evid Based Complement Alternat Med. 2021 Sep 24;2021:7383062. doi: 10.1155/2021/7383062. eCollection 2021. Evid Based Complement Alternat Med. 2021. PMID: 34608397 Free PMC article.
References
-
- Alexopoulou O, Jamart J, Devogelaer JP, Brichard S, de Nayer P, Buysschaert M. Bone density and markers of bone remodeling in type 1 male diabetic patients. Diabetes Metab. 2006;32:453–8. - PubMed
-
- Bain S, Ramamurthy NS, Impeduglia T, Scolman S, Golub LM, Rubin C. Tetracycline prevents cancellous bone loss and maintains near-normal rates of bone formation in streptozotocin diabetic rats. Bone. 1997;21:147–53. - PubMed
-
- Beisswenger PJ, Drummond KS, Nelson RG, Howell SK, Szwergold BS, Mauer M. Susceptibility to diabetic nephropathy is related to dicarbonyl and oxidative stress. Diabetes. 2005;54:3274–81. - PubMed
-
- Bennett CN, Ouyang H, Ma YL, Zeng Q, Gerin I, Sousa KM, Lane TF, Krishnan V, Hankenson KD, MacDougald OA. Wnt10b increases postnatal bone formation by enhancing osteoblast differentiation. J Bone Miner Res. 2007;22:1924–32. - PubMed
Publication types
MeSH terms
Substances
Grants and funding
LinkOut - more resources
Full Text Sources
Other Literature Sources
Medical
