. 2014:147:1-22.
doi: 10.2528/pier14032303.

Photoacoustic tomography: principles and advances

Affiliations

Photoacoustic tomography: principles and advances

Jun Xia et al. Electromagn Waves (Camb). 2014.

Abstract

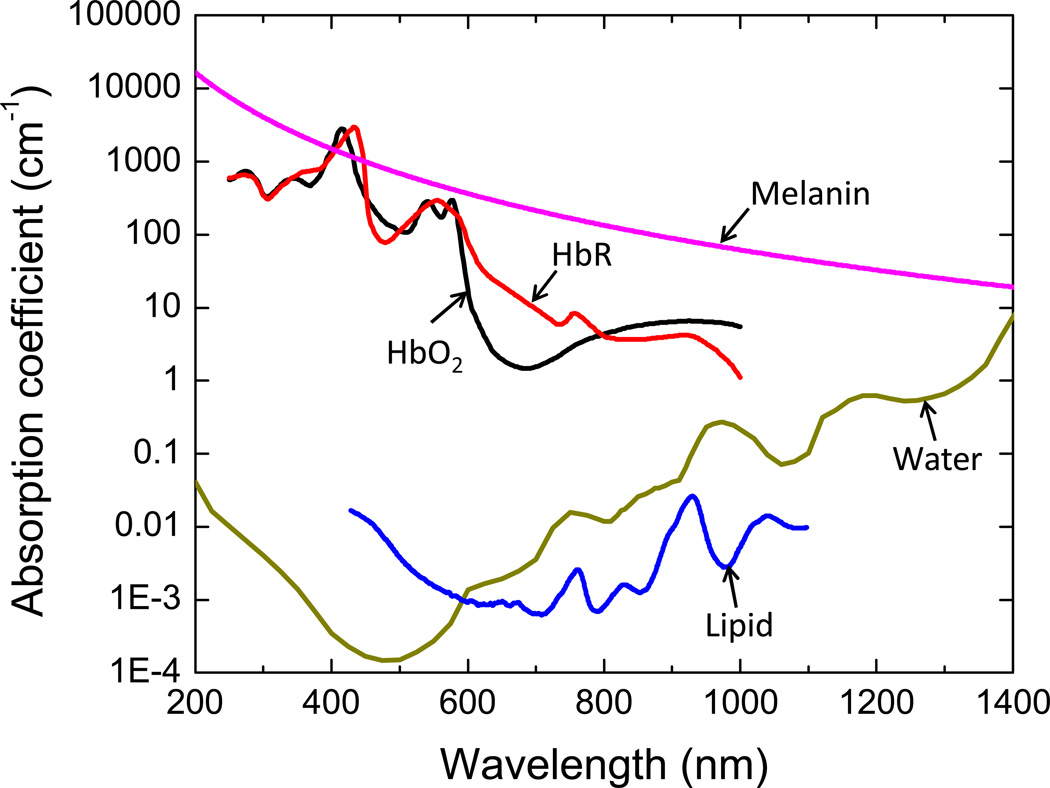
Photoacoustic tomography (PAT) is an emerging imaging modality that shows great potential for preclinical research and clinical practice. As a hybrid technique, PAT is based on the acoustic detection of optical absorption from either endogenous chromophores, such as oxy-hemoglobin and deoxy-hemoglobin, or exogenous contrast agents, such as organic dyes and nanoparticles. Because ultrasound scatters much less than light in tissue, PAT generates high-resolution images in both the optical ballistic and diffusive regimes. Over the past decade, the photoacoustic technique has been evolving rapidly, leading to a variety of exciting discoveries and applications. This review covers the basic principles of PAT and its different implementations. Strengths of PAT are highlighted, along with the most recent imaging results.

Keywords: Photoacoustic tomography; anatomical imaging; brain imaging; functional imaging; molecular imaging; nanoparticle; photoacoustic computed tomography; photoacoustic microscopy; super resolution; tumor imaging; vascular imaging.


Figures

Figure 1
Figure 1
Absorption coefficient spectra of endogenous tissue chromophores at their typical concentrations in the human body. Oxy-hemoglobin (HbO2) and deoxy-hemoglobin (HbR), 150 gL−1. Water, 60% by weight. Lipid, 16% by weight. Melanin concentration corresponds to that in normal skin. Adapted from http://omlc.ogi.edu.
Figure 2
Figure 2
(a) Schematic illustrating the operation of the Fabry-Perot interferometer-based PACT imaging system. Photoacoustic waves are generated by the absorption of nanosecond optical pulses provided by a wavelength-tunable OPO laser and detected by a transparent Fabry-Perot polymer film ultrasound sensor. The sensor comprises a pair of dichroic mirrors separated by a 40 µm thick polymer spacer, thus forming a Fabry-Perot interferometer (FPI). The waves are mapped in 2D by raster-scanning a CW focused interrogation laser beam across the sensor and recording the acoustically induced modulation of the reflectivity of the FPI at each scanning point. (b) Maximum amplitude projection of the complete three dimensional image dataset (depth 0 to 6 mm), showing two embryos (shaded red). Reproduced with permission from [75].
Figure 3
Figure 3
(a) Schematic of a ring-shaped confocal photoacoustic computed tomography (RC-PACT) system. (b)–(c) In vivo RC-PACT images of athymic mice acquired noninvasively at the (b) liver and (c) kidney regions. BM, backbone muscle; GI, GI tract; KN, kidney; LV, liver; PV, portal vein; SC, spinal cord; SP, spleen; and VC, vena cava. Reproduced with permission from [78, 79].
Figure 4
Figure 4
(a) Photograph of an arc-array-based spherical-view PACT system. (b) Three-dimensional photoacoustic image of a female nude mouse. Reproduced with permission from [80].
Figure 5
Figure 5
Photoacoustic microscopy (PAM). (a) Second-generation optical-resolution photoacoustic microscopy system (2G-OR-PAM), where the lateral resolution is determined by the diffraction-limited optical focusing. AL, acoustic lens; Corl, correction lens; RAP, right angled prism; RhP, rhomboid prism; SOL, silicone oil layer; UT, ultrasonic transducer; WT, water tank. (b) Dark-field acoustic-resolution photoacoustic microscopy (AR-PAM), where the lateral resolution is determined by the diffraction-limited acoustic focusing. (c–d) In vivo label-free mouse ear vasculature imaged by (a) OR-PAM and (b) AR-PAM. A representative cross-sectional image is shown at the bottom. While OR-PAM shows better resolution, AR-PAM has greater penetration depth (shown by arrows). Reproduced with permission from [94].
Figure 6
Figure 6
Multi-scale photoacoustic images of LacZ gene expression. (a) B-scan image of a lacZ-marked tumor at a 5-cm depth in biological tissue, acquired by overlaying chicken breast tissue on top of a mouse. Photoacoustic images are colored green, while ultrasonic images are in gray. (b) 3D depiction of a composite photoacoustic image, showing the tumor and blood vessels imaged with AR-PAM. Green: tumor. The scale bar represents 2 mm. (c) An OR-PAM image of fixed lacZ cells grown on a cover glass after staining with Xgal. nu: cell nucleus. The scale bar represents 10 µm. Reproduced with permission from [99].
Figure 7
Figure 7
Super-resolution photoacoustic microscopy. (a) Photoimprint photoacoustic microscopy (PI-PAM) [102]. Since the photobleaching rate depends on the local excitation intensity, the first excitation bleaches the center part of the illuminated region more than the periphery, leaving an imprint in the sample. The differential signal between before- and after-bleaching images results in a smaller effective excitation size and thus a resolution enhancement, as shown by the dashed circle in the bottom panel. (b) PI-PAM imaging of gold nanoparticles with enhanced lateral resolution. (c) Wavefront-shaping assisted sub-acoustic resolution PA imaging. Each photoacoustic emission from the speckle grains is weighted by the Gaussian detection sensitivity of the acoustic transducer [104]. (d–e) Photoacoustic images of a sweet bee wing created with (d) random optical speckle illumination and (e) wavefront optimized speckle focus, showing the superior resolution of the latter method. Adapted with permission from [102, 104].
Figure 8
Figure 8
Multi-parameter PA imaging. (a) Photograph of a mouse ear bearing a U87 glioblastoma tumor. (b) Depth-encoded vascular image acquired with OR-PAM, showing the tortuous blood vessels in the tumor. (c) sO2 map of the tumor region, showing the hyperoxic status of the early-stage tumor.
Figure 9
Figure 9
Photoacoustic molecular imaging. (a) PACT of a glioblastoma in a mouse brain enhanced by IRDye800-c(KRGDf), which targeted overexpressed integrin αvβ3 in tumor cells. (b) PAT of a glioblastoma in a mouse brain enhanced by tri-modality MRI-PA-Raman (MPR) nanoparticles. Reproduced with permission from [23, 158].

References

    1. Wang LV. Multiscale photoacoustic microscopy and computed tomography. Nat Photon. 2009;3:503–509. - PMC - PubMed
    1. Wang LV, Hu S. Photoacoustic Tomography: In Vivo Imaging from Organelles to Organs. Science. 2012 Mar 23;335:1458–1462. 2012. - PMC - PubMed
    1. Zhang HF, Maslov K, Stoica G, Wang LV. Functional photoacoustic microscopy for high-resolution and noninvasive in vivo imaging. Nat Biotech. 2006;24:848–851. - PubMed
    1. Fang H, Maslov K, Wang LV. Photoacoustic Doppler effect from flowing small light-absorbing particles. Physical Review Letters. 2007 Nov 2;99:184501. - PubMed
    1. Yao J, Maslov KI, Zhang Y, Xia Y, Wang LV. Label-free oxygen-metabolic photoacoustic microscopy in vivo. Journal of Biomedical Optics. 2011 Jul;16:076003. - PMC - PubMed