

Understanding reliance on automation: effects of error type, error distribution, age and experience
- PMID: 25642142
- PMCID: PMC4307024
- DOI: 10.1080/1463922X.2011.611269
Understanding reliance on automation: effects of error type, error distribution, age and experience
Abstract
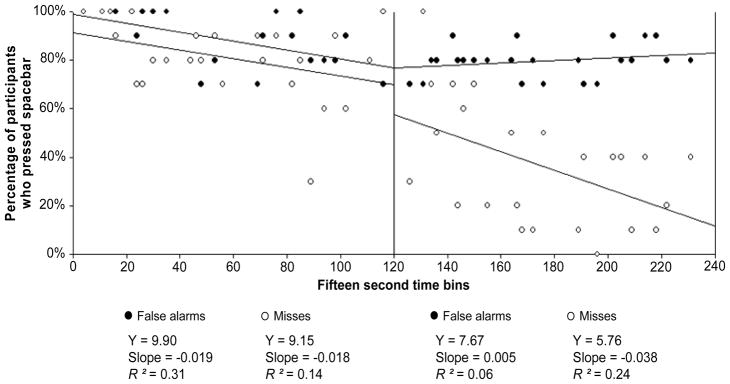
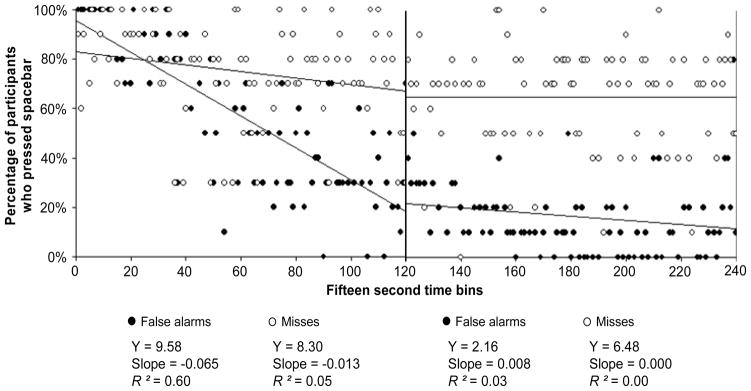
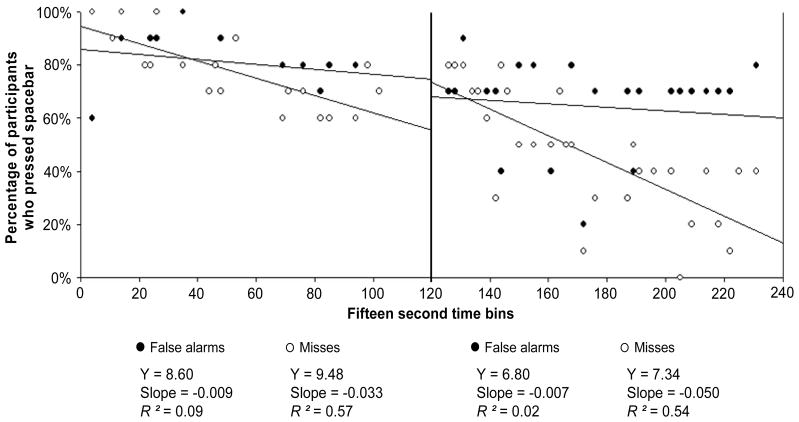
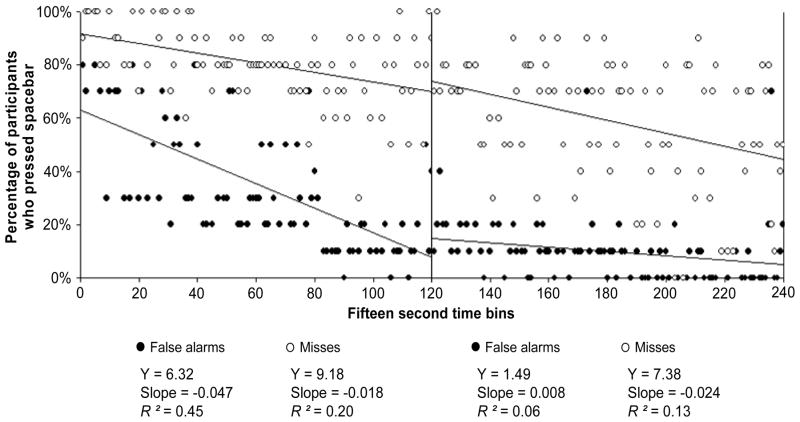
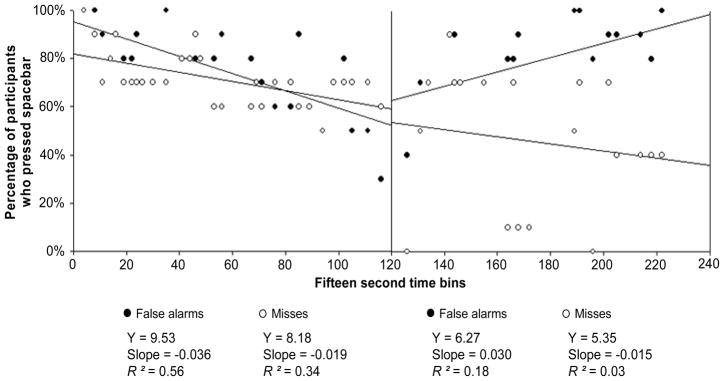
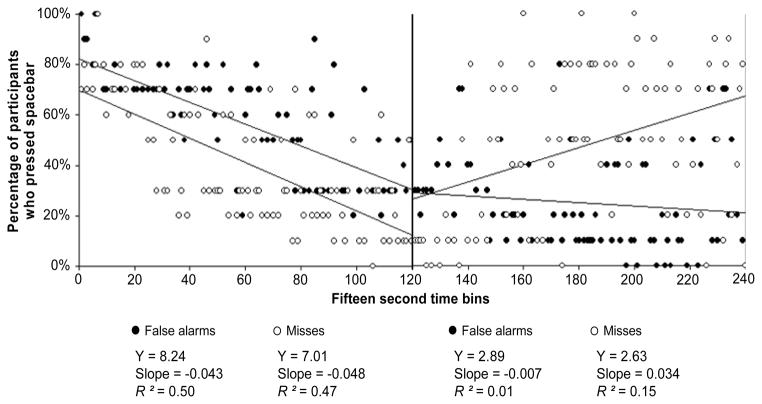
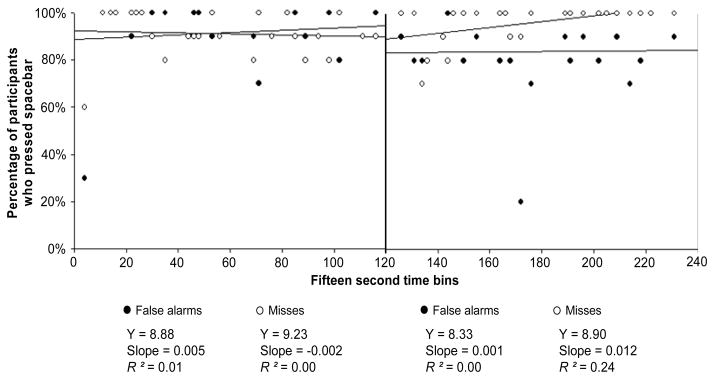
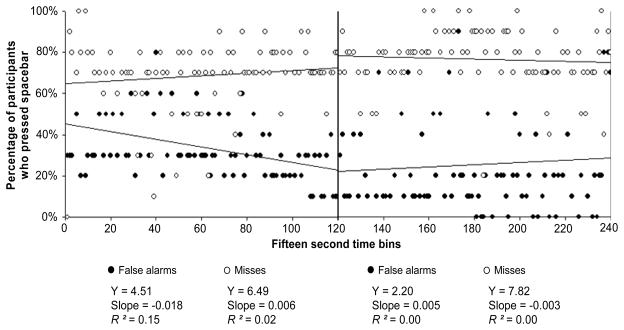
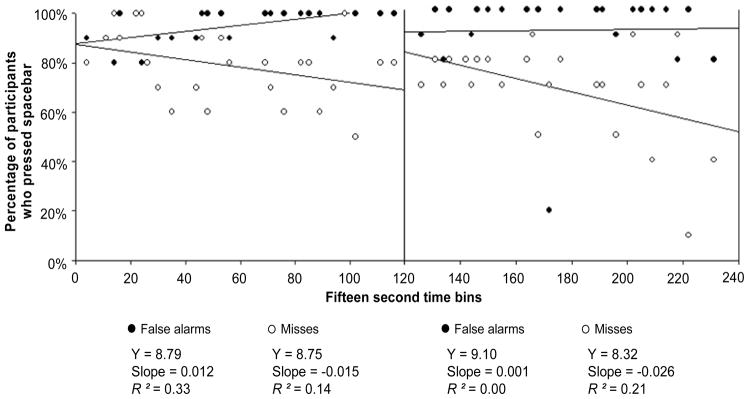
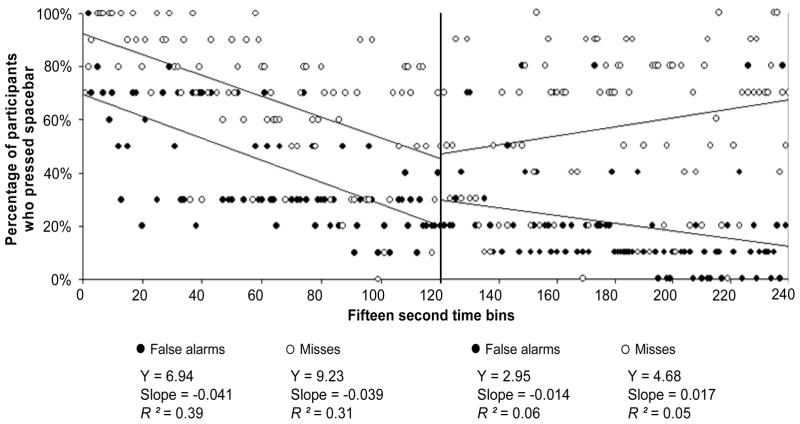
An obstacle detection task supported by "imperfect" automation was used with the goal of understanding the effects of automation error types and age on automation reliance. Sixty younger and sixty older adults interacted with a multi-task simulation of an agricultural vehicle (i.e. a virtual harvesting combine). The simulator included an obstacle detection task and a fully manual tracking task. A micro-level analysis provided insight into the way reliance patterns change over time. The results indicated that there are distinct patterns of reliance that develop as a function of error type. A prevalence of automation false alarms led participants to under-rely on the automation during alarm states while over relying on it during non-alarms states. Conversely, a prevalence of automation misses led participants to over-rely on automated alarms and under-rely on the automation during non-alarm states. Older adults adjusted their behavior according to the characteristics of the automation similarly to younger adults, although it took them longer to do so. The results of this study suggest the relationship between automation reliability and reliance depends on the prevalence of specific errors and on the state of the system. Understanding the effects of automation detection criterion settings on human-automation interaction can help designers of automated systems make predictions about human behavior and system performance as a function of the characteristics of the automation.
Figures

Similar articles
-
On the independence of compliance and reliance: are automation false alarms worse than misses?Hum Factors. 2007 Aug;49(4):564-72. doi: 10.1518/001872007X215656. Hum Factors. 2007. PMID: 17702209
-
Understanding the effect of workload on automation use for younger and older adults.Hum Factors. 2011 Dec;53(6):672-86. doi: 10.1177/0018720811421909. Hum Factors. 2011. PMID: 22235529 Free PMC article.
-
Trust and the Compliance-Reliance Paradigm: The Effects of Risk, Error Bias, and Reliability on Trust and Dependence.Hum Factors. 2017 May;59(3):333-345. doi: 10.1177/0018720816682648. Epub 2016 Dec 19. Hum Factors. 2017. PMID: 28430544
-
Trust in automation: designing for appropriate reliance.Hum Factors. 2004 Spring;46(1):50-80. doi: 10.1518/hfes.46.1.50_30392. Hum Factors. 2004. PMID: 15151155 Review.
-
Dangerous intersections? A review of studies of fatigue and distraction in the automated vehicle.Accid Anal Prev. 2019 May;126:85-94. doi: 10.1016/j.aap.2018.04.004. Epub 2018 Apr 10. Accid Anal Prev. 2019. PMID: 29653675 Review.
Cited by
-
Dissociable effects of fatigue on performance and metacognition from automatic target cuing in undersea threat detection.Cogn Res Princ Implic. 2025 Jun 15;10(1):29. doi: 10.1186/s41235-025-00638-1. Cogn Res Princ Implic. 2025. PMID: 40518486 Free PMC article.
-
Looking for Age Differences in Self-Driving Vehicles: Examining the Effects of Automation Reliability, Driving Risk, and Physical Impairment on Trust.Front Psychol. 2019 Apr 26;10:800. doi: 10.3389/fpsyg.2019.00800. eCollection 2019. Front Psychol. 2019. PMID: 31105610 Free PMC article.
-
Beyond Binary Decisions: Evaluating the Effects of AI Error Type on Trust and Performance in AI-Assisted Tasks.Hum Factors. 2025 Mar 19:187208251326795. doi: 10.1177/00187208251326795. Online ahead of print. Hum Factors. 2025. PMID: 40104968 Free PMC article.
-
Understanding human management of automation errors.Theor Issues Ergon Sci. 2014;15(6):545-577. doi: 10.1080/1463922X.2013.817625. Theor Issues Ergon Sci. 2014. PMID: 25383042 Free PMC article.
-
Trust with increasing and decreasing reliability.Hum Factors. 2024 Dec;66(12):2569-2589. doi: 10.1177/00187208241228636. Epub 2024 Mar 6. Hum Factors. 2024. PMID: 38445652 Free PMC article.
References
-
- Bliss J. An investigation of alarm related accidents and incidents in aviation. International Journal of Aviation Psychology. 2003;13:249–268.
-
- Bliss JP, Gilson RD, Deaton JE. Human probability matching behaviour in response to alarms of varying reliability. Ergonomics. 1995;38:2300–2312. - PubMed
-
- Breznitz S. Cry wolf: The psychology of false alarms. Hillsdale, NJ: LEA; 1984.
-
- Center for Disease Control. 2003 http://www.cdc.gov/mmwr/preview/mmwrhtml/mm.5206a2.htm Retrieved June 6, 2011.
-
- Cotte N, Meyer J, Coughlin JF. Older and younger drivers’ reliance on collision warning systems. Proceedings of the Human Factors Society, 45th annual meeting; Santa Monica, CA: Human Factors and Ergonomics Society; 2001. pp. 277–280.
Grants and funding
LinkOut - more resources
Full Text Sources