

Genome-wide analysis and expression profiling suggest diverse roles of GH3 genes during development and abiotic stress responses in legumes
- PMID: 25642236
- PMCID: PMC4294127
- DOI: 10.3389/fpls.2014.00789
Genome-wide analysis and expression profiling suggest diverse roles of GH3 genes during development and abiotic stress responses in legumes
Abstract
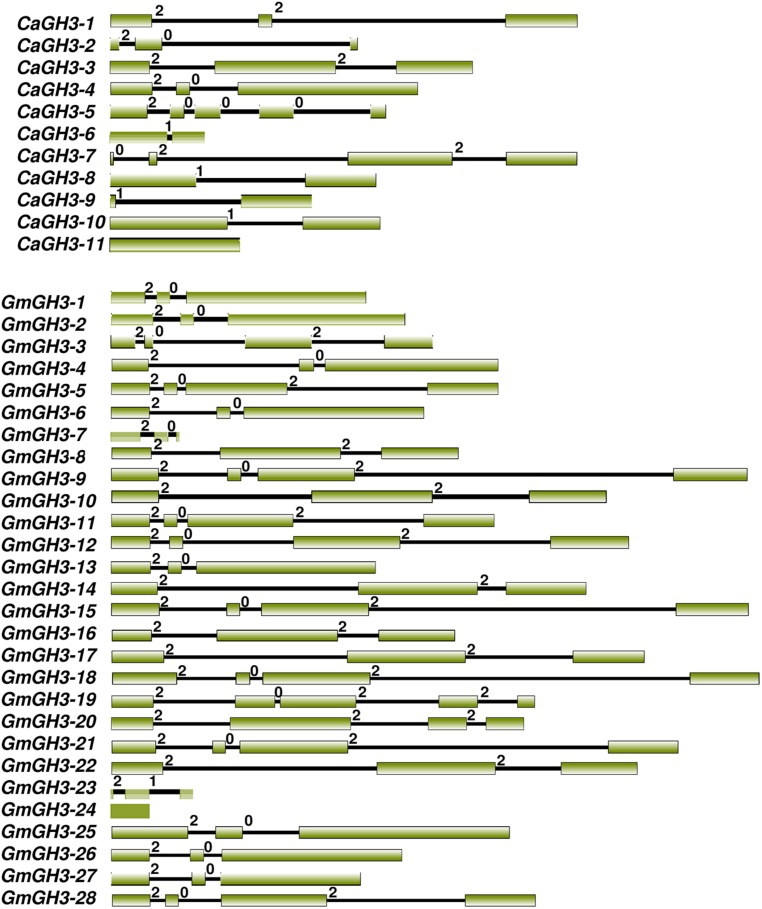
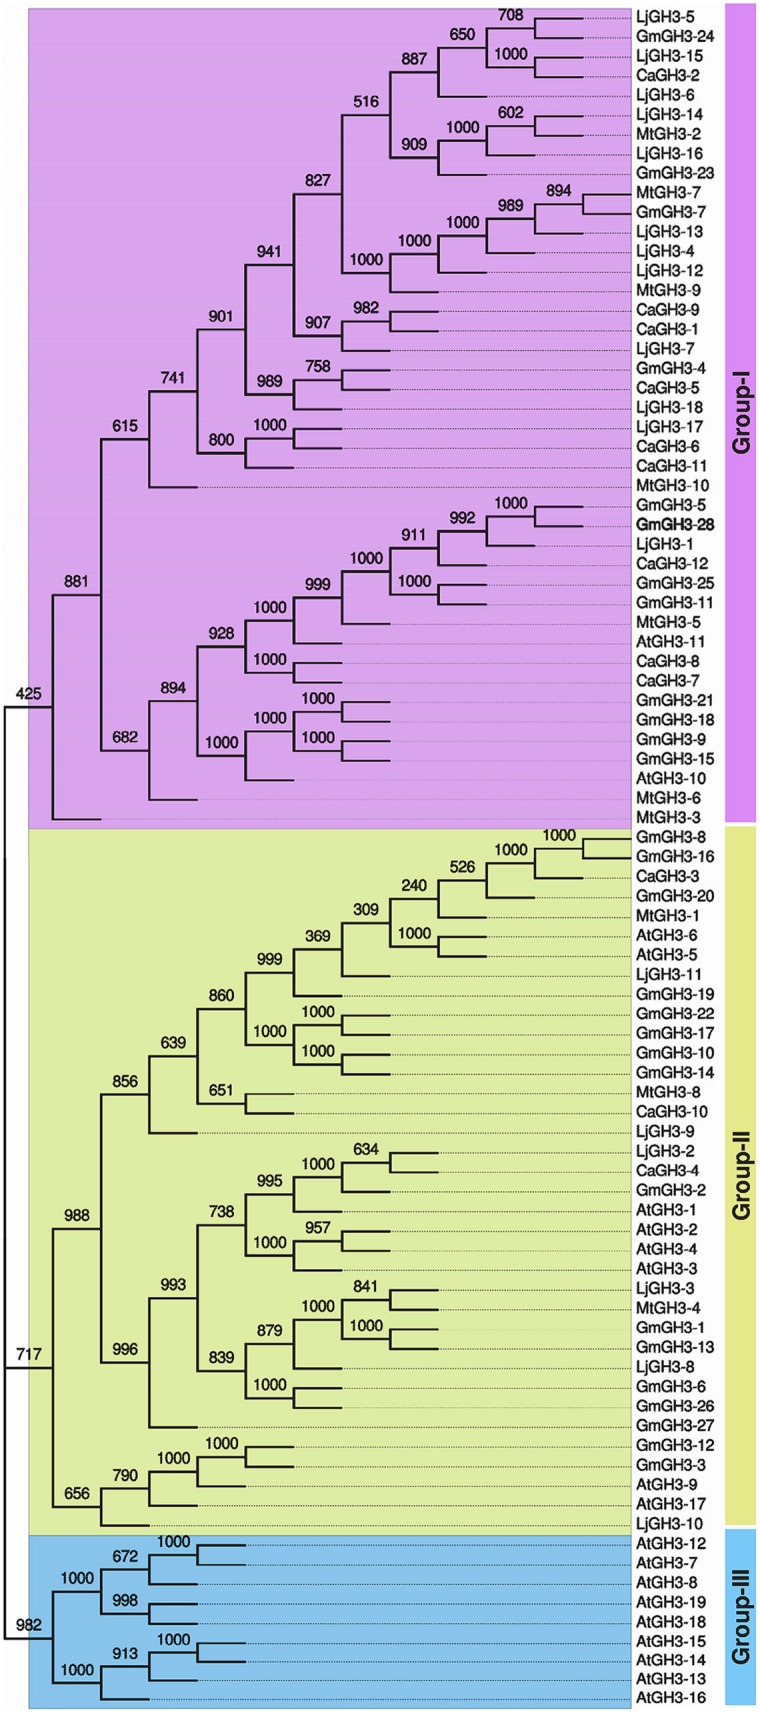
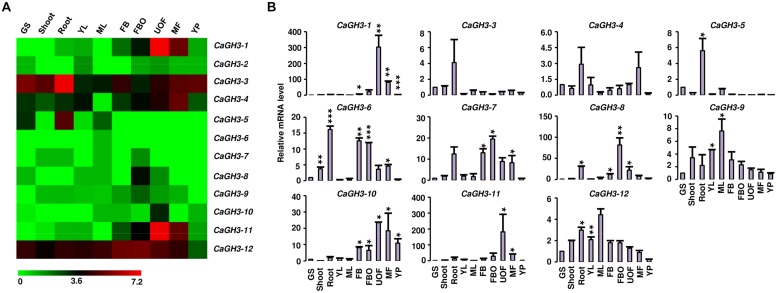
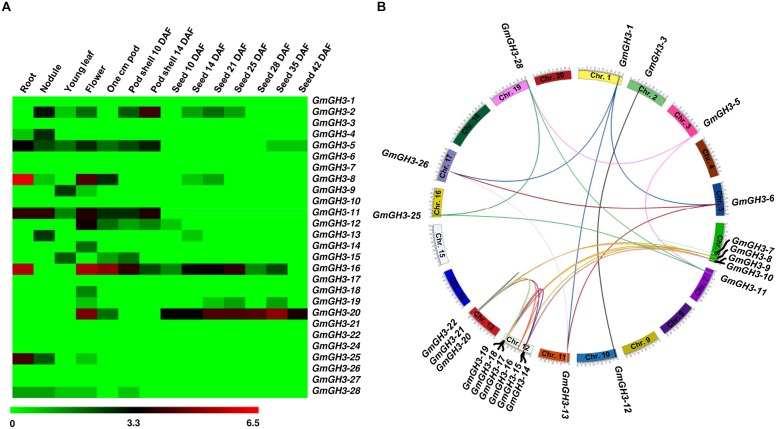
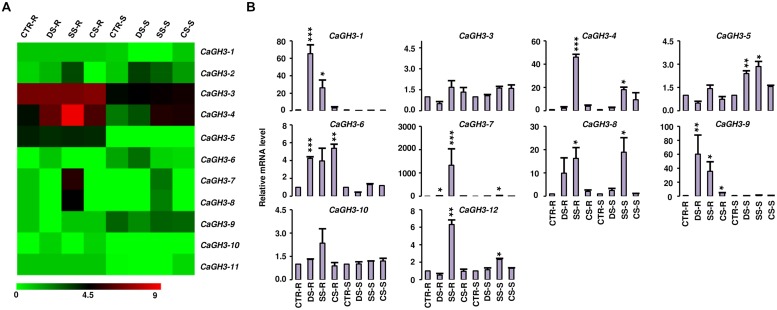
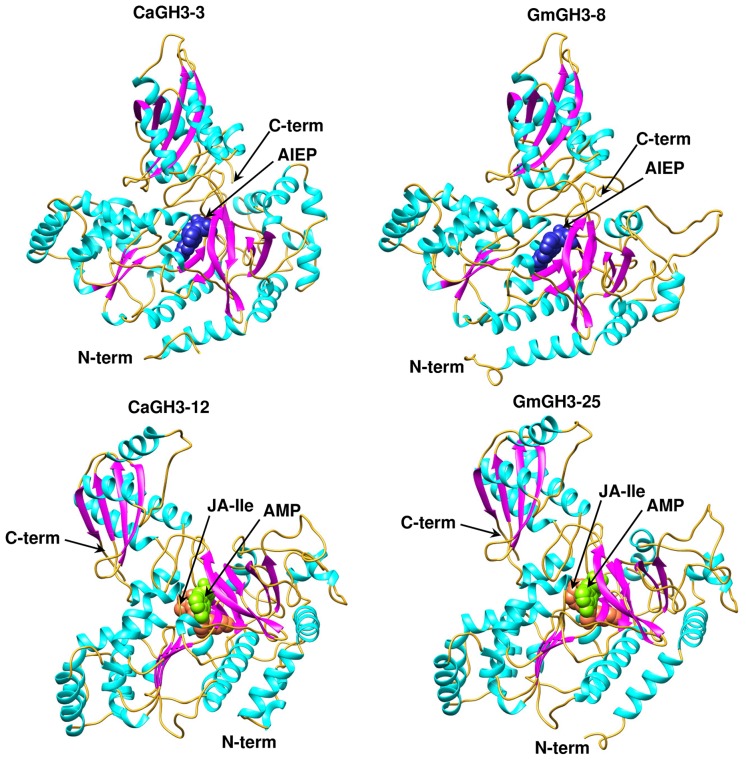
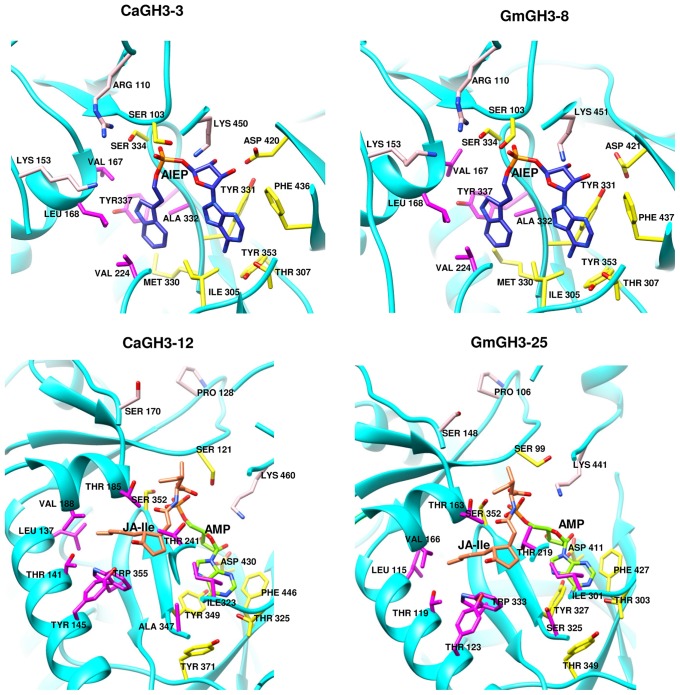
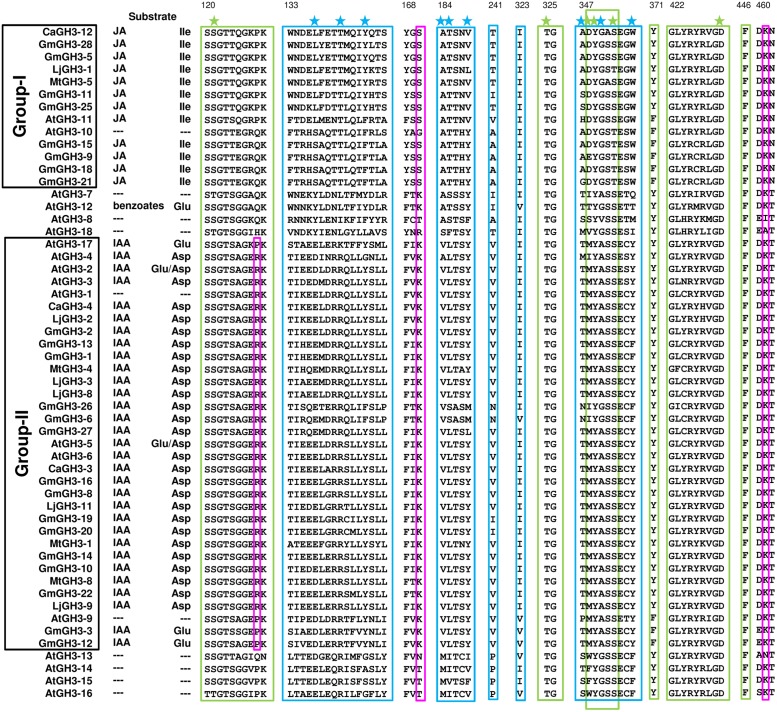
Growth hormone auxin regulates various cellular processes by altering the expression of diverse genes in plants. Among various auxin-responsive genes, GH3 genes maintain endogenous auxin homeostasis by conjugating excess of auxin with amino acids. GH3 genes have been characterized in many plant species, but not in legumes. In the present work, we identified members of GH3 gene family and analyzed their chromosomal distribution, gene structure, gene duplication and phylogenetic analysis in different legumes, including chickpea, soybean, Medicago, and Lotus. A comprehensive expression analysis in different vegetative and reproductive tissues/stages revealed that many of GH3 genes were expressed in a tissue-specific manner. Notably, chickpea CaGH3-3, soybean GmGH3-8 and -25, and Lotus LjGH3-4, -5, -9 and -18 genes were up-regulated in root, indicating their putative role in root development. In addition, chickpea CaGH3-1 and -7, and Medicago MtGH3-7, -8, and -9 were found to be highly induced under drought and/or salt stresses, suggesting their role in abiotic stress responses. We also observed the examples of differential expression pattern of duplicated GH3 genes in soybean, indicating their functional diversification. Furthermore, analyses of three-dimensional structures, active site residues and ligand preferences provided molecular insights into function of GH3 genes in legumes. The analysis presented here would help in investigation of precise function of GH3 genes in legumes during development and stress conditions.
Keywords: GH3 genes; RNA-seq; gene family; homology modeling; legumes; substrate specificities.
Figures
Similar articles
-
Genome-wide identification, expression analysis of GH3 family genes in Medicago truncatula under stress-related hormones and Sinorhizobium meliloti infection.Appl Microbiol Biotechnol. 2015 Jan;99(2):841-54. doi: 10.1007/s00253-014-6311-5. Epub 2014 Dec 23. Appl Microbiol Biotechnol. 2015. PMID: 25529315
-
Genome-wide survey and comprehensive expression profiling of Aux/IAA gene family in chickpea and soybean.Front Plant Sci. 2015 Oct 27;6:918. doi: 10.3389/fpls.2015.00918. eCollection 2015. Front Plant Sci. 2015. PMID: 26579165 Free PMC article.
-
Molecular characterization of the GH3 family in alfalfa under abiotic stress.Gene. 2023 Jan 30;851:146982. doi: 10.1016/j.gene.2022.146982. Epub 2022 Oct 19. Gene. 2023. PMID: 36270456
-
Genome-wide identification, expression analysis of auxin-responsive GH3 family genes in maize (Zea mays L.) under abiotic stresses.J Integr Plant Biol. 2015 Sep;57(9):783-95. doi: 10.1111/jipb.12327. Epub 2015 Mar 11. J Integr Plant Biol. 2015. PMID: 25557253
-
Genome-wide analysis and expression profiling of the PIN auxin transporter gene family in soybean (Glycine max).BMC Genomics. 2015 Nov 16;16:951. doi: 10.1186/s12864-015-2149-1. BMC Genomics. 2015. PMID: 26572792 Free PMC article.
Cited by
-
Whole-genome resequencing identifies quantitative trait loci associated with mycorrhizal colonization of soybean.Theor Appl Genet. 2020 Feb;133(2):409-417. doi: 10.1007/s00122-019-03471-5. Epub 2019 Nov 9. Theor Appl Genet. 2020. PMID: 31707439
-
A comprehensive analysis of the B3 superfamily identifies tissue-specific and stress-responsive genes in chickpea (Cicer arietinum L.).3 Biotech. 2019 Sep;9(9):346. doi: 10.1007/s13205-019-1875-5. Epub 2019 Aug 26. 3 Biotech. 2019. PMID: 31497464 Free PMC article.
-
Impact of Some Toxic Metals on Important ABC Transporters in Soybean (Glycine max L.).ACS Omega. 2023 Jul 19;8(30):27597-27611. doi: 10.1021/acsomega.3c03325. eCollection 2023 Aug 1. ACS Omega. 2023. PMID: 37546587 Free PMC article.
-
Comprehensive Analysis of GH3 Gene Family in Potato and Functional Characterization of StGH3.3 under Drought Stress.Int J Mol Sci. 2023 Oct 12;24(20):15122. doi: 10.3390/ijms242015122. Int J Mol Sci. 2023. PMID: 37894803 Free PMC article.
-
MATH-Domain Family Shows Response toward Abiotic Stress in Arabidopsis and Rice.Front Plant Sci. 2016 Jun 28;7:923. doi: 10.3389/fpls.2016.00923. eCollection 2016. Front Plant Sci. 2016. PMID: 27446153 Free PMC article.
References
-
- Böttcher C., Dennis E. G., Booker G. W., Polyak S. W., Boss P. K., Davies C. (2012). A novel tool for studying auxin-metabolism: the inhibition of grapevine indole-3-acetic acid-amido synthetases by a reaction intermediate analogue. PLoS ONE 7:e37632 10.1371/journal.pone.0037632 - DOI - PMC - PubMed
LinkOut - more resources
Full Text Sources
Other Literature Sources