. 2014 Sep 8:6:ecurrents.outbreaks.89c0d3783f36958d96ebbae97348d571.
doi: 10.1371/currents.outbreaks.89c0d3783f36958d96ebbae97348d571.

Early epidemic dynamics of the west african 2014 ebola outbreak: estimates derived with a simple two-parameter model

Affiliations

Early epidemic dynamics of the west african 2014 ebola outbreak: estimates derived with a simple two-parameter model

David Fisman et al. PLoS Curr. .

Abstract

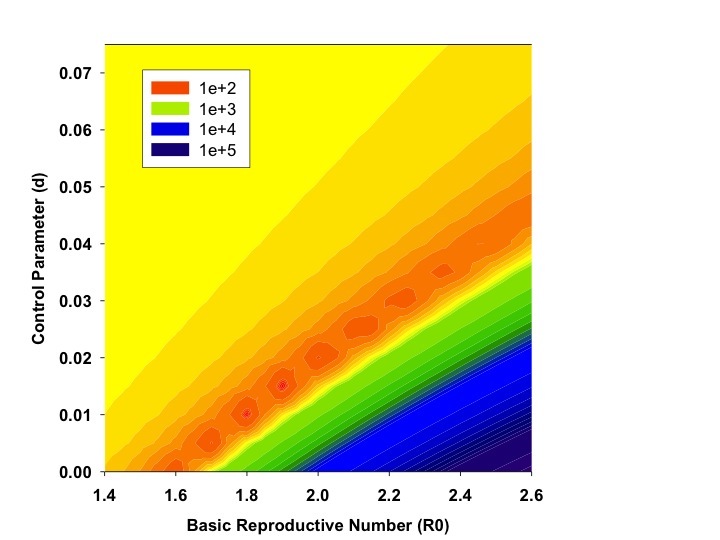
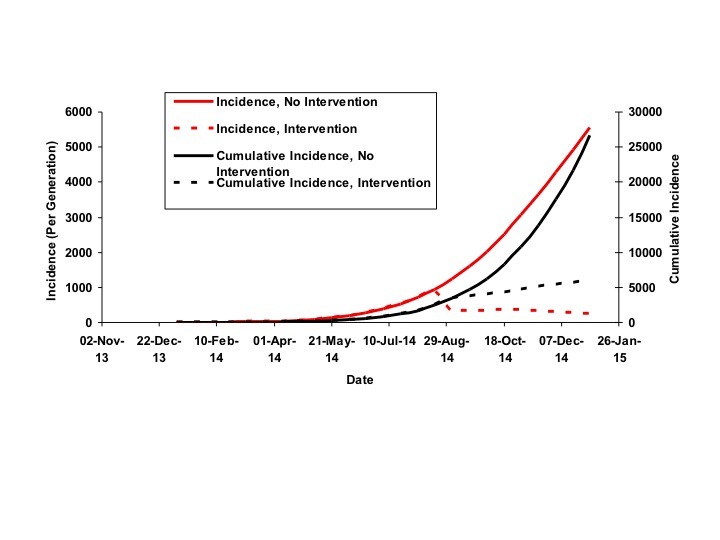
The 2014 West African Ebola virus outbreak, now more correctly referred to as an epidemic, is the largest ever to occur. As of August 28, 2014, concerns have been raised that control efforts, particularly in Liberia, have been ineffective, as reported case counts continue to increase. Limited data are available on the epidemiology of the outbreak. However, reported cumulative incidence data as well as death counts are available for Guinea, Sierra Leone, Liberia and Nigeria. We utilized a simple, two parameter mathematical model of epidemic growth and control, to characterize epidemic growth patterns in West Africa, to evaluate the degree to which the epidemic is being controlled, and to assess the potential implications of growth patterns for epidemic size. Models demonstrated good fits to data. Overall basic reproductive number (R0) for the epidemic was estimated to be between 1.6 and 2.0, consistent with prior outbreaks. However, we identified only weak evidence for the occurrence of epidemic control in West Africa as a whole, and essentially no evidence for control in Liberia (though slowing of growth was seen in Guinea and Sierra Leone). It is projected that small reductions in transmission would prevent tens of thousands of future infections. These findings suggest that there is an extraordinary need for improved control measures for the 2014 Ebola epidemic, especially in Liberia, if catastrophe is to be averted.


Figures

Parameter Estimates by Generation of Epidemic
The graph plots best fit values of R0 (blue curve) and d (pink curve) for the IDEA model obtained by utilizing progressively increasing numbers of epidemic generations (figure shows fits for generation 7 through 15).
Contour Plot of Model Fit as a Function of R0 and <i>d</i>.
Contour Plot of Model Fit as a Function of R0 and d.
Figure plots root mean squared distance (RMSD) of model projected case counts from observed case counts in models utilizing varying combinations of R0 (X-axis) and d (Y-axis). Dark orange areas signifying lowest RMSD are seen with R0 in the 1.75-1.90 range, and with d from 0.01 to 0.015.
Overall Observed vs. Expected Cumulative Incidence
Best fit model (dark curve) (R0 = 1.78, d = 0.009) to observed cumulative incidence for West Africa by generation (gray bars). A 15 day serial interval is assumed, and first reported cases are assumed to have been reported in generation 5.
Projections of Incidence and Cumulative Incidence to January 1, 2015
The figure plots model-projected incidence (per 15-day generation) (solid red curve, scale on left Y-axis) and cumulative incidence (solid black curve, scale on right Y-axis) against time (X-axis). Dashed curves show the potential impact of intervention in September 2014 on incidence (dashed red curve) and cumulative incidence (dashed black curve), if intervention resulted in an increase of d by 0.005.
Country Specific Model Fits, Observed vs. Expected Cumulative Incidence
Graphs demonstrate good model fits (dark curves) to observed generation by generation cumulative incidence of infection in Guinea (top panel), Liberia (middle panel), and Sierra Leone (bottom panel).
Overall vs. Country-Level Model Fits
Graphs show good agreement between the base-case model, fit to overall cumulative incidence data (all countries combined, solid gray curve) vs. summed outputs (solid black curve) from models fit to country-level data from Guinea (dashed black curve), Liberia (thin black curve), and Sierra Leone (dashed gray curve).

References

    1. Fisman DN, Hauck TS, Tuite AR, Greer AL. An IDEA for short term outbreak projection: nearcasting using the basic reproduction number. PLoS One. 2013;8(12):e83622. PubMed PMID:24391797. - PMC - PubMed
    1. Chowell G, Hengartner NW, Castillo-Chavez C, Fenimore PW, Hyman JM. The basic reproductive number of Ebola and the effects of public health measures: the cases of Congo and Uganda. J Theor Biol. 2004 Jul 7;229(1):119-26. PubMed PMID:15178190. - PubMed
    1. Eichner M, Dowell SF, Firese N. Incubation period of ebola hemorrhagic virus subtype zaire. Osong Public Health Res Perspect. 2011 Jun;2(1):3-7. PubMed PMID:24159443. - PMC - PubMed
    1. Legrand J, Grais RF, Boelle PY, Valleron AJ, Flahault A. Understanding the dynamics of Ebola epidemics. Epidemiol Infect. 2007 May;135(4):610-21. PubMed PMID:16999875. - PMC - PubMed
    1. Kortepeter MG, Bausch DG, Bray M. Basic clinical and laboratory features of filoviral hemorrhagic fever. J Infect Dis. 2011 Nov;204 Suppl 3:S810-6. PubMed PMID:21987756. - PubMed

LinkOut - more resources