Twitter improves influenza forecasting
- PMID: 25642377
- PMCID: PMC4234396
- DOI: 10.1371/currents.outbreaks.90b9ed0f59bae4ccaa683a39865d9117
Twitter improves influenza forecasting
Abstract
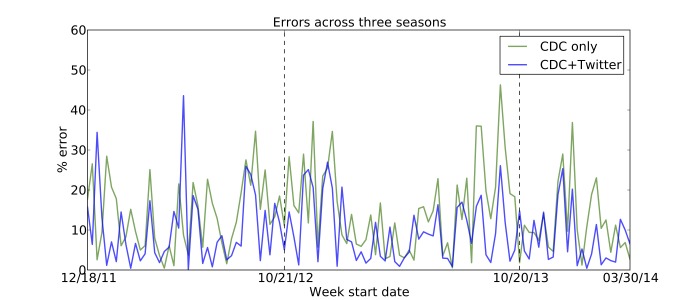
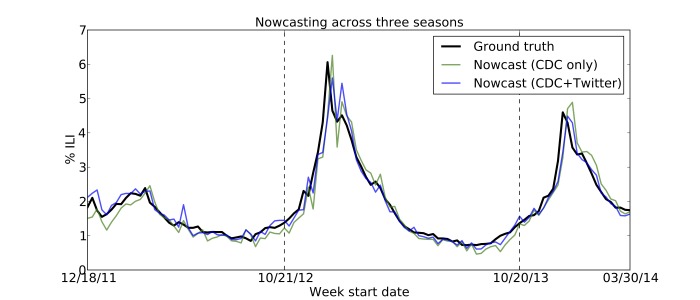
Accurate disease forecasts are imperative when preparing for influenza epidemic outbreaks; nevertheless, these forecasts are often limited by the time required to collect new, accurate data. In this paper, we show that data from the microblogging community Twitter significantly improves influenza forecasting. Most prior influenza forecast models are tested against historical influenza-like illness (ILI) data from the U.S. Centers for Disease Control and Prevention (CDC). These data are released with a one-week lag and are often initially inaccurate until the CDC revises them weeks later. Since previous studies utilize the final, revised data in evaluation, their evaluations do not properly determine the effectiveness of forecasting. Our experiments using ILI data available at the time of the forecast show that models incorporating data derived from Twitter can reduce forecasting error by 17-30% over a baseline that only uses historical data. For a given level of accuracy, using Twitter data produces forecasts that are two to four weeks ahead of baseline models. Additionally, we find that models using Twitter data are, on average, better predictors of influenza prevalence than are models using data from Google Flu Trends, the leading web data source.
Figures
References
-
- Culotta, A. Towards detecting influenza epidemics by analyzing Twitter messages. In ACM Workshop on Social Media Analytics. 2010. 10.1145/1964858.1964874 - DOI
LinkOut - more resources
Full Text Sources
Other Literature Sources