. 2015 Mar;47(3):291-5.
doi: 10.1038/ng.3211. Epub 2015 Feb 2.

LD Score regression distinguishes confounding from polygenicity in genome-wide association studies

Collaborators, Affiliations

LD Score regression distinguishes confounding from polygenicity in genome-wide association studies

Brendan K Bulik-Sullivan et al. Nat Genet. 2015 Mar.

Abstract

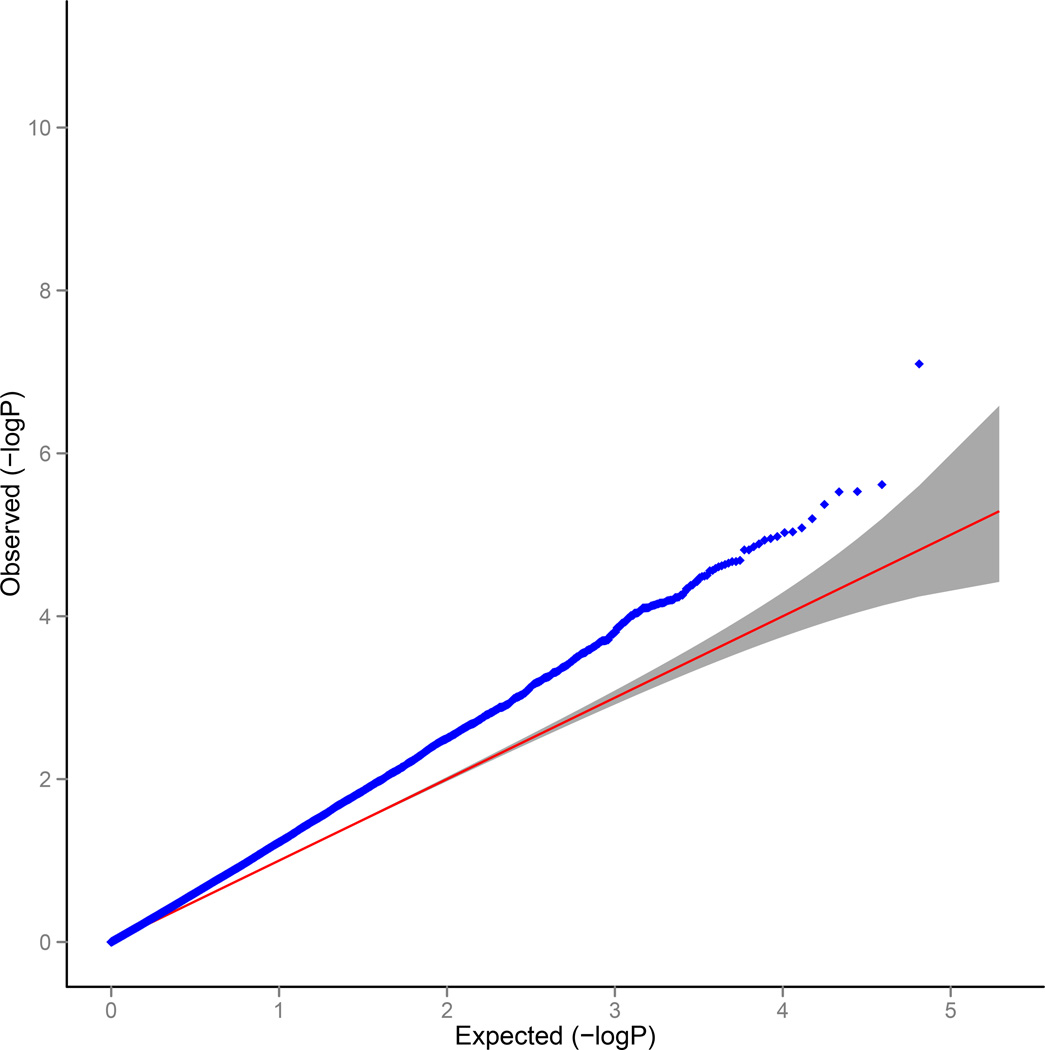
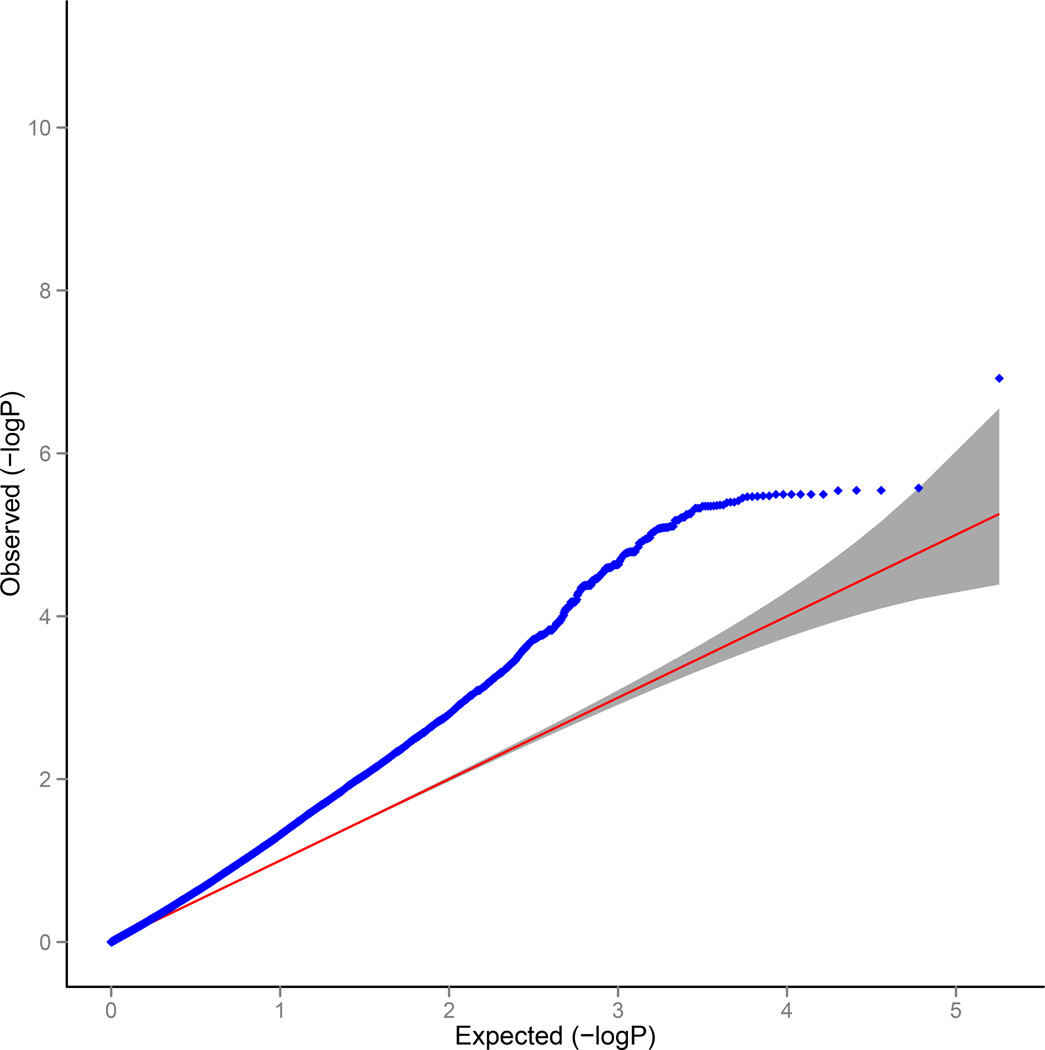
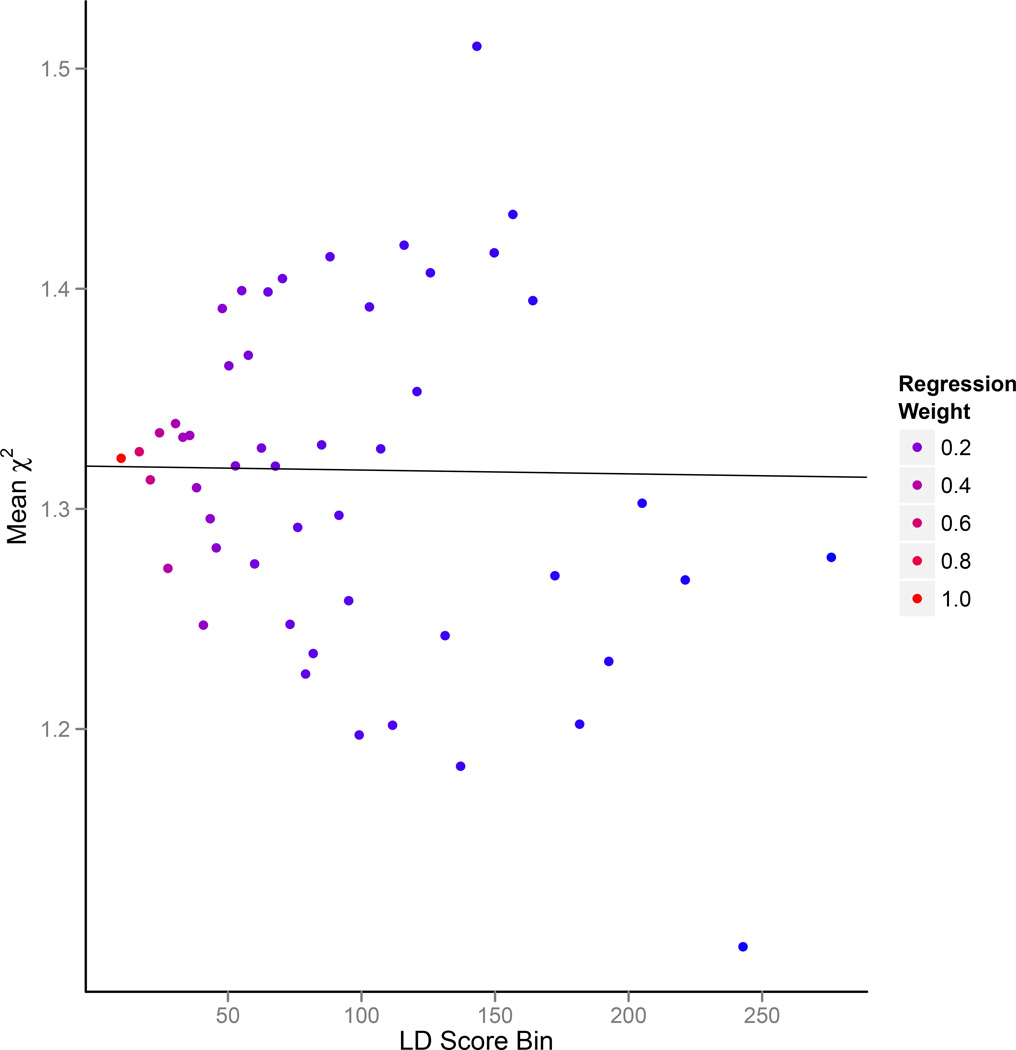
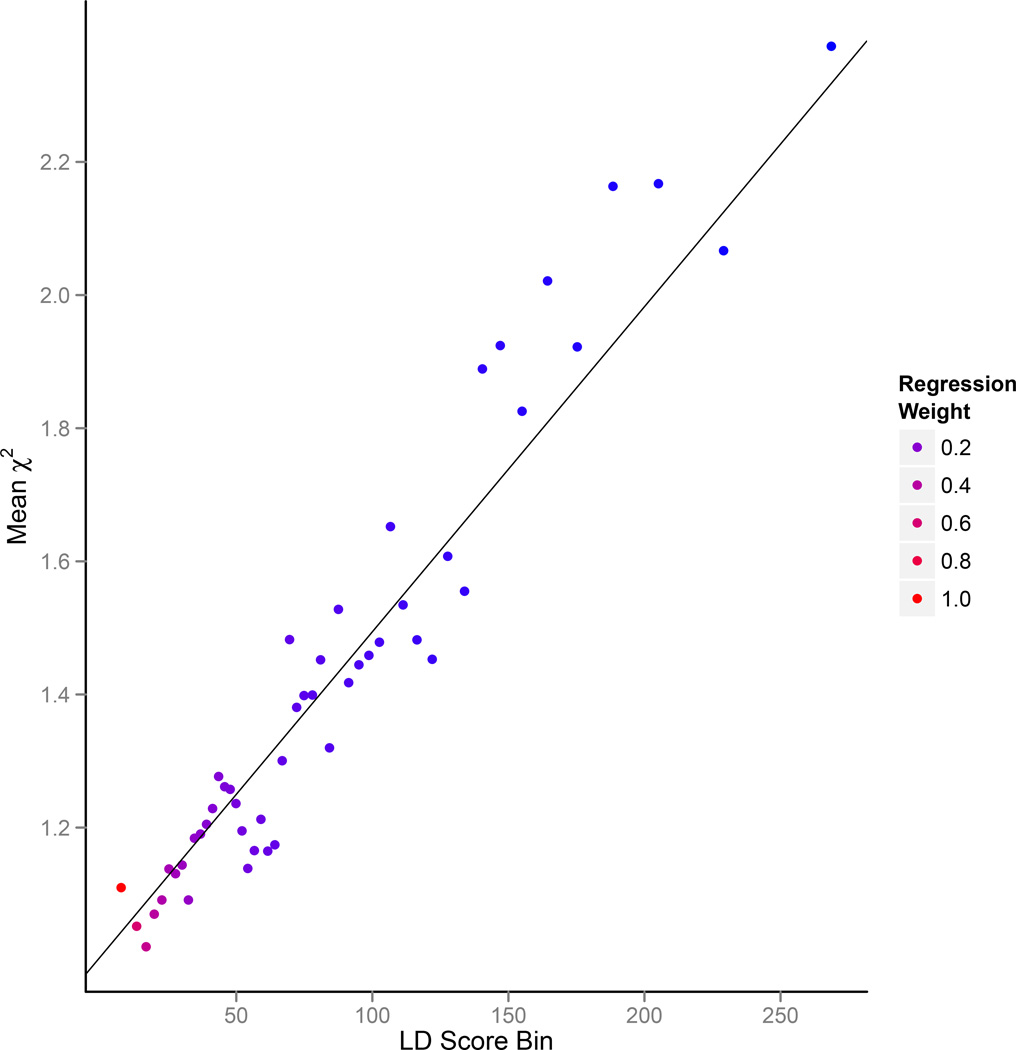
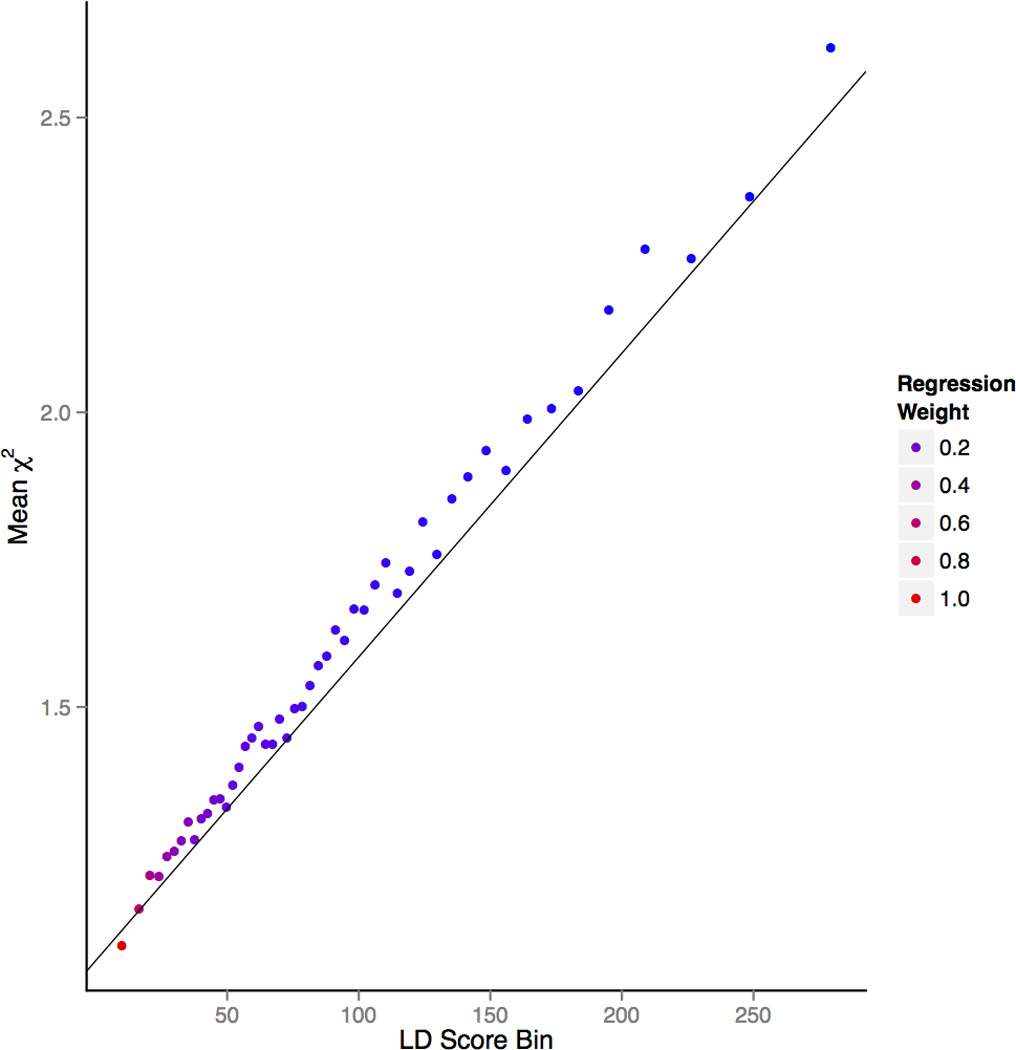
Both polygenicity (many small genetic effects) and confounding biases, such as cryptic relatedness and population stratification, can yield an inflated distribution of test statistics in genome-wide association studies (GWAS). However, current methods cannot distinguish between inflation from a true polygenic signal and bias. We have developed an approach, LD Score regression, that quantifies the contribution of each by examining the relationship between test statistics and linkage disequilibrium (LD). The LD Score regression intercept can be used to estimate a more powerful and accurate correction factor than genomic control. We find strong evidence that polygenicity accounts for the majority of the inflation in test statistics in many GWAS of large sample size.


Figures

Figure 1
Figure 1
Results from selected simulations. (a) QQ plot with population stratification (λGC = 1.32, LD Score regression intercept = 1.30). (b) QQ plot with polygenic genetic architecture with 0.1% of SNPs causal (λGC = 1.32, LD Score regression intercept = 1.006) (c) LD Score plot with population stratification. Each point represents an LD Score quantile, where the x-coordinate of the point is the mean LD Score of variants in that quantile and the y-coordinate is the mean χ2 of variants in that quantile. Colors correspond to regression weights, with red indicating large weight. The black line is the LD Score regression line. (d) As in panel c but LD Score plot with polygenic genetic architecture.
Figure 1
Figure 1
Results from selected simulations. (a) QQ plot with population stratification (λGC = 1.32, LD Score regression intercept = 1.30). (b) QQ plot with polygenic genetic architecture with 0.1% of SNPs causal (λGC = 1.32, LD Score regression intercept = 1.006) (c) LD Score plot with population stratification. Each point represents an LD Score quantile, where the x-coordinate of the point is the mean LD Score of variants in that quantile and the y-coordinate is the mean χ2 of variants in that quantile. Colors correspond to regression weights, with red indicating large weight. The black line is the LD Score regression line. (d) As in panel c but LD Score plot with polygenic genetic architecture.
Figure 2
Figure 2
D Score regression plot for the current schizophrenia meta-analysis. Each point represents an LD Score quantile, where the x-coordinate of the point is the mean LD Score of variants in that quantile and the y-coordinate is the mean χ2 of variants in that quantile. Colors correspond to regression weights, with red indicating large weight. The black line is the LD Score regression line. The line appears to fall below the points on the right because this is a weighted regression in which the points on the left receive the largest weights (Online Methods).

References

    1. Pritchard JK, Przeworski M. Linkage disequilibrium in humans: models and data. Am J Hum Genet. 2001;69:1–14. - PMC - PubMed
    1. Sham PC, Cherny SS, Purcell S, Hewitt JK. Power of linkage versus association analysis of quantitative traits, by use of variance-components models, for sibship data. Am J Hum Genet. 2000;66:1616–1630. - PMC - PubMed
    1. Yang J, et al. Genomic inflation factors under polygenic inheritance. Eur J Hum Genet. 2011;19:807–812. - PMC - PubMed
    1. Voight BF, Pritchard JK. Confounding from cryptic relatedness in case-control association studies. PLoS Genet. 2005;1:e32. - PMC - PubMed
    1. Devlin B, Roeder K. Genomic control for association studies. Biometrics. 1999;55:997–1004. - PubMed

Publication types