. 2015 Mar;47(3):284-90.
doi: 10.1038/ng.3190. Epub 2015 Feb 2.

Efficient Bayesian mixed-model analysis increases association power in large cohorts

Affiliations

Efficient Bayesian mixed-model analysis increases association power in large cohorts

Po-Ru Loh et al. Nat Genet. 2015 Mar.

Abstract

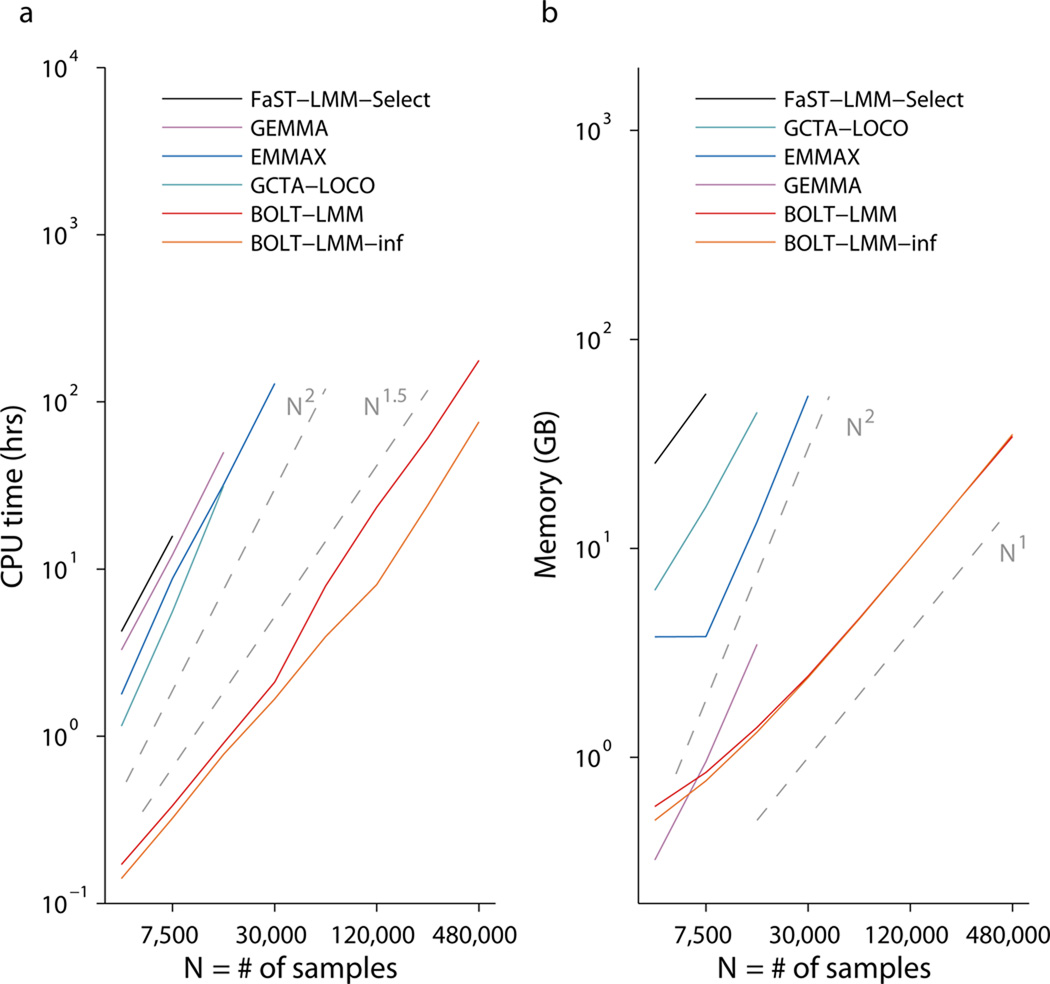
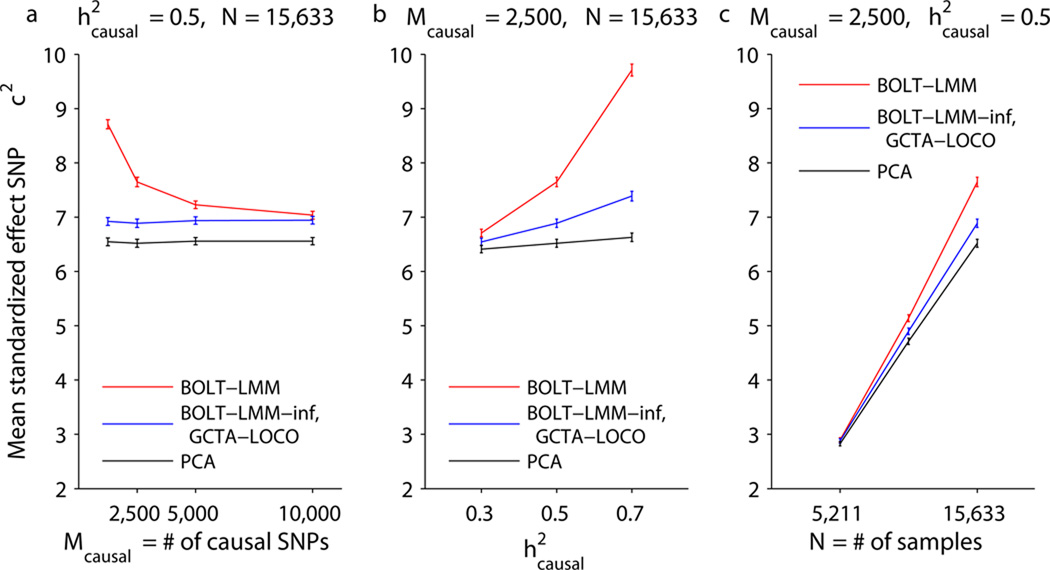
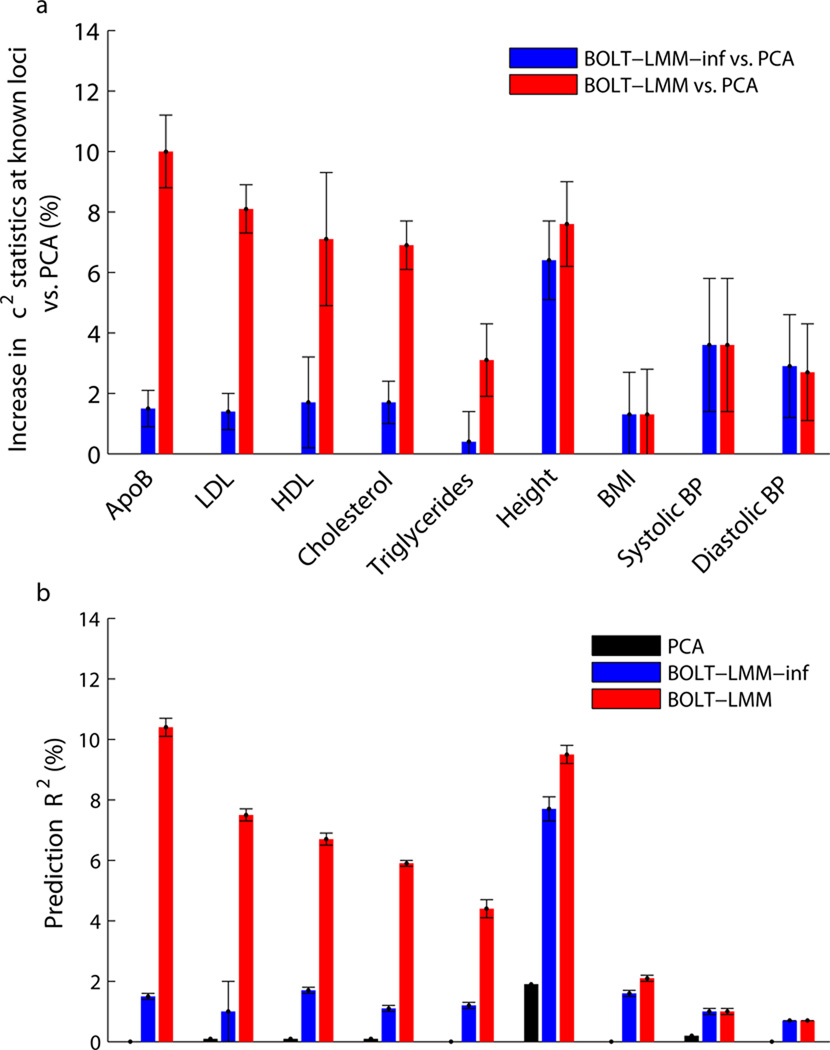
Linear mixed models are a powerful statistical tool for identifying genetic associations and avoiding confounding. However, existing methods are computationally intractable in large cohorts and may not optimize power. All existing methods require time cost O(MN(2)) (where N is the number of samples and M is the number of SNPs) and implicitly assume an infinitesimal genetic architecture in which effect sizes are normally distributed, which can limit power. Here we present a far more efficient mixed-model association method, BOLT-LMM, which requires only a small number of O(MN) time iterations and increases power by modeling more realistic, non-infinitesimal genetic architectures via a Bayesian mixture prior on marker effect sizes. We applied BOLT-LMM to 9 quantitative traits in 23,294 samples from the Women's Genome Health Study (WGHS) and observed significant increases in power, consistent with simulations. Theory and simulations show that the boost in power increases with cohort size, making BOLT-LMM appealing for genome-wide association studies in large cohorts.


Figures

Figure 1
Figure 1. Computational performance of mixed model association methods
Log-log plots of (a) run time and (b) memory as a function of sample size (N). Slopes of the curves correspond to exponents of power-law scaling with N. Benchmarking was performed on simulated data sets in which each sample was generated as a mosaic of genotype data from 2 random “parents” from the WTCCC2 data set (N=15,633, M=360K) and phenotypes were simulated with Mcausal=5,000 SNPs explaining h2causal=0.2 of phenotypic variance. Reported run times are medians of five identical runs using one core of a 2.27 GHz Intel Xeon L5640 processor. We caution that running time comparisons may vary by a small constant factor as a function of computing environment. FaST-LMM-Select (resp. GCTA-LOCO, EMMAX) memory usage exceeded the 96GB available at N=15K (resp. 30K, 60K). GEMMA encountered a runtime error (segmentation fault) at N=30K. Software versions: FaST-LMM-Select, v2.07; GCTA-LOCO, v1.24; EMMAX, v20120210; GEMMA, v0.94. Numerical data are provided in Supplementary Table 1.
Figure 2
Figure 2. BOLT-LMM increases power to detect associations in simulations
Mean χ2 at standardized effect SNPs as a function of (a) number of causal SNPs, (b) proportion of variance explained by causal SNPs, (c) number of samples. Simulations used real genotypes from the WTCCC2 data set (N=15,633, M=360K) and simulated phenotypes with the specified number of causal SNPs explaining the specified proportion of phenotypic variance and 60 more standardized effect SNPs explaining an additional 2% of the variance. Error bars, s.e.m., 100 simulations. We verified on the first 5 simulations that the BOLT-LMM-inf and GCTA-LOCO statistics are nearly identical (Supplementary Table 7). Numerical data are provided in Supplementary Table 2.
Figure 3
Figure 3. BOLT-LMM increases power to detect associations for WGHS phenotypes
We compare power (measured using two roughly equivalent metrics) of linear regression using 10 principal components, standard (infinitesimal) mixed model analysis, and BOLT-LMM Gaussian mixture model analysis. (a) Percent increases in χ2 statistics across known loci using mixed model methods vs. PCA: ratios of sums of χ2 statistics over typed SNPs in highest LD with published associated SNPs. (b) Prediction R2 values from 5-fold cross-validation: each fold was left out in turn and predictions were computed by fitting all SNP effects simultaneously (for mixed model methods) or estimating covariate effects (for PCA) using the training folds. (Note that BOLT-LMM-inf is equivalent to BLUP prediction here.) We show PCA in (b) because the small amount of variance that the PCs explain (due to population stratification) provides a baseline that allows translating prediction R2 to the power gain of mixed model association vs. regression with PC covariates. That is, the correspondence between association power and prediction accuracy is such that the red bars in (a) roughly correspond to differences between red and black bars in (b), and analogously for blue bars (Online Methods). Error bars, jackknife s.e. over (a) known loci (Supplementary Table 8); (b) 5 cross-validation folds. Numerical data are provided in Supplementary Table 9.

References

    1. Yu J, et al. A unified mixed-model method for association mapping that accounts for multiple levels of relatedness. Nature Genetics. 2006;38:203–208. - PubMed
    1. Kang HM, et al. Efficient control of population structure in model organism association mapping. Genetics. 2008;178:1709–1723. - PMC - PubMed
    1. Kang HM, et al. Variance component model to account for sample structure in genome-wide association studies. Nature Genetics. 2010;42:348–354. - PMC - PubMed
    1. Zhang Z, et al. Mixed linear model approach adapted for genome-wide association studies. Nature Genetics. 2010;42:355–360. - PMC - PubMed
    1. Lippert C, et al. FaST linear mixed models for genome-wide association studies. Nature Methods. 2011;8:833–835. - PubMed

References (Online Methods)

    1. Chen W-M, Abecasis GR. Family-based association tests for genomewide association scans. American Journal of Human Genetics. 2007;81:913–926. - PMC - PubMed
    1. Aulchenko YS, De Koning D-J, Haley C. Genomewide rapid association using mixed model and regression: a fast and simple method for genomewide pedigree-based quantitative trait loci association analysis. Genetics. 2007;177:577–585. - PMC - PubMed
    1. Chen W-M, Manichaikul A, Rich SS. A generalized family-based association test for dichotomous traits. American Journal of Human Genetics. 2009;85:364–376. - PMC - PubMed
    1. Boyd SP, Vandenberghe L. Convex Optimization. Cambridge University Press; 2004.
    1. Yang J, et al. Genome partitioning of genetic variation for complex traits using common SNPs. Nature Genetics. 2011;43:519–525. - PMC - PubMed

Publication types