. 2015 Mar 2;125(3):1098-110.
doi: 10.1172/JCI76344. Epub 2015 Feb 2.

Cytosolic HMGB1 controls the cellular autophagy/apoptosis checkpoint during inflammation

Cytosolic HMGB1 controls the cellular autophagy/apoptosis checkpoint during inflammation

Xiaorong Zhu et al. J Clin Invest. .

Abstract

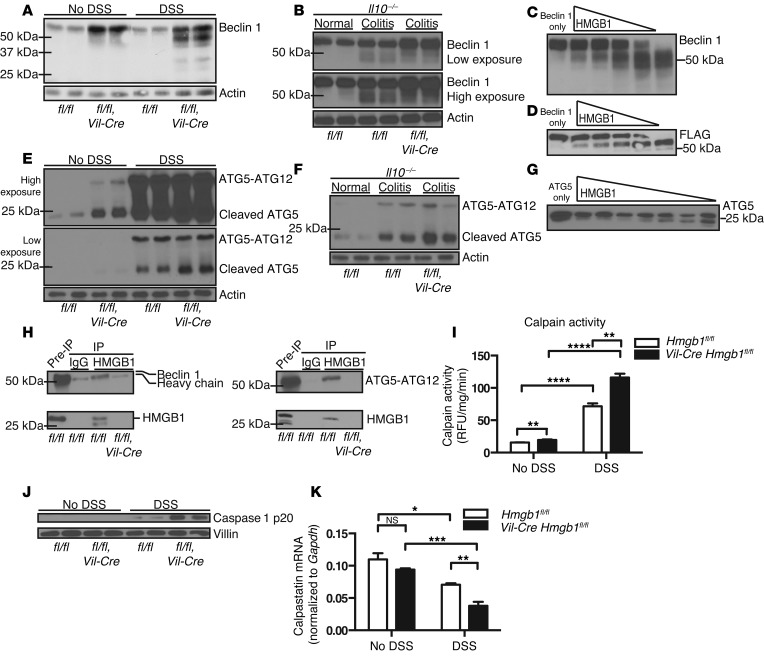
The intracellular protein HMGB1 is released from cells and acts as a damage-associated molecular pattern molecule during many diseases, including inflammatory bowel disease (IBD); however, the intracellular function of HMGB1 during inflammation is poorly understood. Here, we demonstrated that cytosolic HMGB1 regulates apoptosis by protecting the autophagy proteins beclin 1 and ATG5 from calpain-mediated cleavage during inflammation. Colitis in mice with an intestinal epithelial cell-specific Hmgb1 deletion and patients with IBD were both characterized by increased calpain activation, beclin 1 and ATG5 cleavage, and intestinal epithelial cell (IEC) death compared with controls. In vitro cleavage assays and studies of enteroids verified that HMGB1 protects beclin 1 and ATG5 from calpain-mediated cleavage events that generate proapoptotic protein fragments. Together, our results indicate that HMGB1 is essential for mitigating the extent and severity of inflammation-associated cellular injury by controlling the switch between the proautophagic and proapoptotic functions of beclin 1 and ATG5 during inflammation. Moreover, these studies demonstrate that HMGB1 is pivotal for reducing tissue injury in IBD and other complex inflammatory disorders.


Figures

Figure 7
Figure 7. HMGB1 protects beclin 1 and ATG5 from calpain-mediated cleavage and conversion from proautophagic to proapoptotic functions.
(A) Calpain activation occurs secondarily to inflammasome-mediated caspase 1 activation with subsequent degradation and downregulation of the calpain inhibitor calpastatin. Low levels of calpastatin in the presence of calcium lead to autoactivation of calpains. Inflammasome-mediated caspase 1 activation is terminated by autophagic degradation of inflammasomes. (B) HMGB1 interacts with beclin 1 and ATG5 to prevent calpain-mediated cleavage of these proteins, allowing autophagy to proceed. (C) In the absence of HMGB1, beclin 1 and ATG5 are cleaved by calpain, generating protein fragments that localize to the mitochondria and trigger cell death.
Figure 6
Figure 6. IBD in humans is associated with decreased HMGB1, beclin 1, and ATG5 cleavage and increased cell death.
(A) HMGB1 expression by qRT-PCR in controls (n = 6) and in patients with active UC (n = 5) or indeterminate colitis (IC) (n = 1) (mean ± SEM). Immunoblot for HMGB1 protein in lysates of snap-frozen endoscopic biopsies. Lanes 1–4, controlled CD patients; lanes 5–8, active CD patients (mean ± SEM). (B) Confocal microscopic images of endoscopic biopsies stained for Hoechst (blue) and HMGB1 (red) in controls (n = 3) and in patients with active UC (n = 4) (original magnification, ×400). Colocalization evaluated using Pearson’s correlation coefficient with the Costes correction (mean ± SEM). (C) Beclin 1 immunoblot. Lane 1, control/normal; lane 2, control/normal; lane 3, control/quiescent CD; lane 4, moderate UC; lane 5, moderate UC; and lane 6, severe CD (mean ± SEM). (D) Immunoblot for ATG5 in lysates of snap-frozen endoscopic biopsies (mean ± SEM). Samples were loaded as in A. (E) Immunoblot with antibody recognizing the active p19/p17 fragments of cleaved caspase 3. Samples were loaded as in Figure 4D. (F) Immunoblot for the active p20 fragment of cleaved caspase 1. Samples were loaded as in Figure 4D. (G) Calpain activity as evaluated by cleavage of the fluorescent substrate in samples from controls (n = 3) and from patients with active UC (n = 3) (mean ± SEM). (H) Calpastatin levels analyzed by qRT-PCR in controls (n = 6) and in patients with active UC (n = 5) or IC (n = 1) (mean ± SEM). Data were analyzed by 2-tailed Student’s t tests, except for data in G, which were determined by the 1-tailed Student’s t test. *P < 0.05; **P < 0.01; ****P < 0.001.
Figure 5
Figure 5. Loss of cell-intrinsic HMGB1 functions leads to IEC death.
IEC progenitors were isolated from the small intestines of Hmgb1fl/fl (n = 4) and Vil-Cre Hmgb1fl/fl (n = 4) mice and grown in culture until intestinal enteroids formed. The cells were then treated with 10 μg/ml L-18 MDP and lysed in 1% Triton lysis buffer. (A) Immunoblot for HMGB1 in lysates from cells treated with MDP for 4 hours. (B) Immunoblot for beclin 1 in lysates from cells treated with MDP for 4 hours. (C) Immunoblot for active caspase 3 in lysates from cells treated with MDP for 4 hours. (D) Immunoblot for active caspase 3 in lysates from cells treated with MDP for 4 hours in the presence of DMSO (vehicle control) or 1 μg/ml calpeptin. (E) Immunoblot for LC3B in lysates treated with MDP for 4 hours in the presence or absence of 100 nM bafilomycin A1. (F) Immunoblot for beclin 1 in lysates from cells treated with MDP at the indicated time points. (G) Immunoblot for ATG5 in lysates from cells treated with MDP at the indicated time points. (H) Immunoblot for cleaved caspase 3 in lysates from cells treated with MDP at the indicated time points. (I) Calpain activity in enteroid lysates at the indicated times after MDP treatment. Data were analyzed by 2-way ANOVA with Bonferroni’s multiple comparisons test as well as the 2-tailed Student’s t test for between-genotype comparisons within a treatment group **P < 0.01; ****P < 0.001.
Figure 4
Figure 4. Calpain inhibition rescues DSS colitis.
Hmgb1fl/fl and Vil-Cre Hmgb1fl/fl mice were administered 2.5% DSS in their drinking water for 5 days and then sacrificed. Vil-Cre Hmgb1fl/fl mice were also treated with vehicle control or the calpain inhibitor calpeptin (5 mg/kg) by daily i.p. injection. (A) Weight loss on day 5 of DSS administration (mean). (B) H&E-stained sections of formalin-fixed, paraffin-embedded intestines from Vil-Cre Hmgb1fl/fl mice treated with vehicle (n = 4) or calpeptin (n = 4). Images were from areas 10 mm proximal to the animal’s rectum (original magnification, ×400). (C) Immunoblot for beclin 1 in intestinal mucosal scrapings from untreated Hmgb1fl/fl (n = 4) and Vil-Cre Hmgb1fl/fl mice treated with vehicle (n = 4) or calpeptin (n = 4). (D) Immunoblot for ATG5 in intestinal mucosal scrapings from untreated Hmgb1fl/fl (n = 4) and Vil-Cre Hmgb1fl/fl mice treated with vehicle (n = 4) or calpeptin (n = 4). Data were analyzed by 1-way ANOVA with Bonferroni’s multiple comparisons test. **P < 0.01.
Figure 3
Figure 3. HMGB1 protects beclin 1 and ATG5 from cleavage during murine colitis.
(A) Immunoblot for beclin 1 using an antibody that recognizes aa 171–291 of the protein. Blots are representative of Hmgb1fl/fl (n = 4) and Vil-Cre Hmgb1fl/fl (n = 4) mice. (B) Immunoblot for beclin 1 in Hmgb1fl/fl Il10–/– (n = 4) and Vil-Cre Hmgb1fl/fl Il10–/– (n = 4) mice. (C) Beclin 1 immunoblot of the products from an in vitro cleavage assay of beclin 1 by calpain 1 with decreasing amounts of HMGB1. (D) MYC-DDK (FLAG) immunoblot of the products of the beclin 1 in vitro cleavage assay. Recombinant beclin 1 contained a C-terminal MYC-DDK epitope tag. (E) Immunoblot for ATG5 using an antibody that recognizes aa 2–15 of the protein. Blots are representative of Hmgb1fl/fl (n = 4) and Vil-Cre Hmgb1fl/fl (n = 4) mice. (F) Immunoblot for ATG5 in Hmgb1fl/fl Il10–/– (n = 4) and Vil-Cre Hmgb1fl/fl Il10–/– (n = 4) mice. (G) ATG5 immunoblot of the products from an in vitro cleavage assay of ATG5 by calpain 1 with decreasing amounts of HMGB1. (H) Co-IP of HMGB1 and beclin 1 or ATG5 in colonic mucosal lysates from Hmgb1fl/fl (n = 4) and Vil-Cre Hmgb1fl/fl (n = 4) mice treated with DSS for 3 days. (I) Calpain activity assay evaluating cleavage of a fluorogenic calpain 1/2 substrate (Suc-LLVY-AMC) in samples of colonic mucosa from Hmgb1fl/fl (n = 3) and Vil-Cre Hmgb1fl/fl mice (n = 3) on day 3 of DSS treatment (mean ± SEM). (J) Immunoblot for the active p20 fragment of caspase 1 in Hmgb1fl/fl (n = 4) and Vil-Cre Hmgb1fl/fl mice (n = 4) on day 3 of DSS treatment. (K) qRT-PCR for calpastatin in cDNA from Hmgb1fl/fl (n = 6) and Vil-Cre Hmgb1fl/fl mice (n = 6) on day 3 of DSS treatment (mean ± SEM). Data were analyzed by 2-tailed Student’s t tests. *P < 0.05; **P < 0.01; ***P < 0.005; ****P < 0.001. RFU, relative fluorescence units.
Figure 2
Figure 2. The autophagic response to DSS in the intestinal epithelium is blunted in the absence of HMGB1.
(A) Confocal microscopic images of colons from untreated (n = 3) or DSS-treated (day 3) (n = 3) Hmgbfl/fl mice stained for the DNA marker Hoechst (blue) and HMGB1 (red) (original magnification, ×400). Colocalization was evaluated using Pearson’s correlation coefficient with the Costes correction (mean ± SEM) (B) qRT-PCR (mean ± SEM) and immunoblot for HMGB1 expression in colonic mucosal scrapings from untreated (n = 4) and DSS-treated (n = 4) Hmgb1fl/fl mice. (C) Immunoblot for HMGB1 in intestinal mucosal scrapings from Hmgb1fl/fl Il10–/– mice with and without signs of colitis (n = 4). (D) Immunoblot for LC3 and p62 in Hmgb1fl/fl (n = 4) and Vil-Cre Hmgb1fl/fl (n = 4) mice on day 3 of DSS treatment. LC3II represents the lipidated form of LC3 and is increased during autophagy. LC3II/LC3I (mean ± SEM) represents the ratio between the lipidated and unlipidated forms of the protein. (E) Confocal microscopic images of endogenous LC3 staining in frozen colonic sections from Hmgb1fl/fl (n = 3) and Vil-Cre Hmgb1fl/fl (n = 3) mice on day 3 of DSS treatment (original magnification, ×630). Autophagosomes have the appearance of LC3-positive punctate structures. (F) TUNEL staining on frozen colonic sections from Hmgb1fl/fl (n = 3) and Vil-Cre Hmgb1fl/fl (n = 3) mice on day 5 of DSS treatment (original magnification, ×400). Data were analyzed using 2-tailed Student’s t tests, except for the data in F, which were analyzed by 2-way Anova with Bonferroni’s multiple comparisons test as well as the 2-tailed Student’s t test for between-genotype comparisons within a treatment group. *P < 0.05; ****P < 0.001.
Figure 1
Figure 1. Loss of HMGB1 exacerbates DSS and Il10–/– colitis.
(A) Survival curve for 8-week-old Hmgb1fl/fl (n = 12) and Vil-Cre Hmgb1fl/fl (n = 9) littermates treated with 3% DSS for 5 days. The mice were then followed until day 19. (B) Weight loss (mean ± SEM) of Hmgb1fl/fl (n = 19) and Vil-Cre Hmgb1fl/fl (n = 16) mice expressed as a percentage of their initial body weight during a 5-day treatment with 2.5% DSS and a 14-day recovery period. (C) Disease activity index (DAI) (weight loss, stool consistency, and rectal bleeding; mean ± SEM) generated on day 5 from DSS-treated mice (Hmgb1fl/fl, n = 8; Vil-Cre Hmgb1fl/fl, n = 8). (D) Gross appearance and length (mean ± SEM) of the colon on day 14 after DSS (Hmgb1fl/fl, n = 8; Vil-Cre Hmgb1fl/fl, n = 8). (E) H&E staining of formalin-fixed colons from DSS-treated mice on day 14. Images were obtained 20 mm from the rectum (original magnification, ×100) (Hmgb1fl/fl, n = 3; Vil-Cre Hmgb1fl/fl, n = 3). (F) Vil-Cre Hmgb1fl/fl Il10+/– males were mated with Hmgb1fl/fl Il10+/– females, and the progeny (Hmgb1fl/fl Il10–/–, n = 8; Vil-Cre Hmgb1fl/fl Il10–/–, n = 7) were observed for signs of colitis for 8 to 12 weeks. (G) Mean DAI for Hmgb1fl/fl Il10–/– (n = 8) and Vil-Cre Hmgb1fl/fl Il10–/– (n = 7) mice. (H) Histological images of H&E-stained, formalin-fixed colons from Hmgb1fl/fl Il10–/– (n = 4) and Vil-Cre Hmgb1fl/fl Il10–/– (n = 4) littermate mice (original magnification, ×200). The intestine from the Hmgb1fl/fl Il10–/– mouse was essentially normal, while the Vil-Cre Hmgb1fl/fl Il10–/– mouse showed signs of chronic intestinal inflammation and colitis (loss of goblet cells, crypt abscesses, cellular infiltration, elongation of mucosa, and epithelial erosion). Data were analyzed using 2-tailed Student’s t tests. **P < 0.01; ****P < 0.001.

Similar articles

Cited by

References

    1. Jäger S, Stange EF, Wehkamp J. Inflammatory bowel disease: an impaired barrier disease. Langenbecks Arch Surg. 2013;398(1):1–12. doi: 10.1007/s00423-012-1030-9. - DOI - PubMed
    1. Antoni L, Nuding S, Wehkamp J, Stange EF. Intestinal barrier in inflammatory bowel disease. World J Gastroenterol. 2014;20(5):1165–1179. doi: 10.3748/wjg.v20.i5.1165. - DOI - PMC - PubMed
    1. Asselin C, Gendron FP. Shuttling of information between the mucosal and luminal environment drives intestinal homeostasis. FEBS Lett. 2014;588(22):4148–4157. doi: 10.1016/j.febslet.2014.02.049. - DOI - PubMed
    1. Harris HE, Andersson U, Pisetsky DS. HMGB1: a multifunctional alarmin driving autoimmune and inflammatory disease. Nat Rev Rheumatol. 2012;8(4):195–202. doi: 10.1038/nrrheum.2011.222. - DOI - PubMed
    1. Andersson U, Tracey KJ. HMGB1 is a therapeutic target for sterile inflammation and infection. Annu Rev Immunol. 2011;29:139–162. doi: 10.1146/annurev-immunol-030409-101323. - DOI - PMC - PubMed

Publication types

MeSH terms